INVITE-ONLY SCRIPT
업데이트됨 Relative Strength according to Oster (RSO)
Overview:
Relative Strength according to Oster (RSO) is an innovative tool that redefines how traders assess an asset's market strength. Moving beyond traditional indicators, RSO offers a sophisticated and highly responsive measure of an asset's potential to continue performing well. By integrating groundbreaking methodologies, RSO equips traders with unparalleled insights into market dynamics, making it an essential tool for anyone looking to stay ahead in today's fast-paced trading environment.
Understanding RSL (Relative Strength according to Levy):
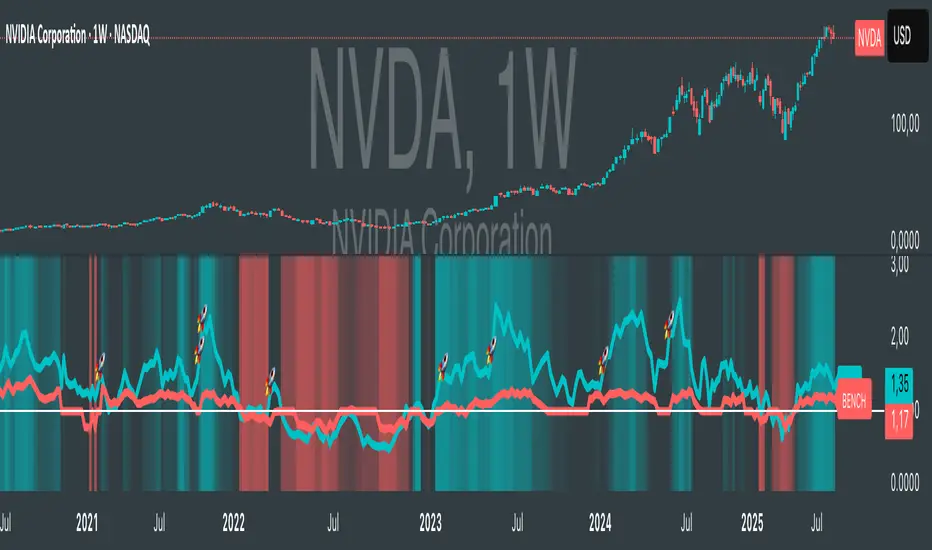
At its core, Relative Strength according to Levy (RSL) is a powerful concept rooted in the idea that an asset currently exhibiting strength is more likely to maintain or even enhance that strength in the future. RSL calculates this by comparing an asset's current price to its moving average, providing a clear picture of its relative performance over time. The further its value is above 1, the higher the market momentum and vice versa. This relationship to the moving average is crucial, as it indicates not just where the asset stands today but also its trajectory in the context of historical performance. The ability to identify assets that consistently outperform is a game-changer for traders, and RSL has long been a cornerstone in this pursuit.
RSO vs. Traditional RSL: A Leap Forward
The RSO takes the traditional RSL concept and propels it into new territory with its innovative correlation-based approach. This is where RSO truly shines, offering a unique and sophisticated analysis that goes far beyond the basics.
Why RSO is Revolutionary:
Practical Application:
The RSO isn’t just innovative in theory; it’s designed for practical, real-world trading. Traders can set customized alerts based on RSO’s readings, ensuring they’re always aware of key buy or sell signals as they occur. The flexibility to include or exclude superior strength factors means that RSO can be tailored to fit any trading style, whether focused on long-term investments or short-term opportunities.
Conclusion:
In conclusion, the Relative Strength according to Oster (RSO) is more than just an indicator; it’s a breakthrough in market analysis. By integrating correlation adjustments and offering unparalleled customization options, RSO provides traders with insights that are both deeper and more actionable than ever before. This innovative tool is designed to empower traders, giving them the edge they need to succeed in an increasingly complex market landscape. Whether you’re a seasoned trader or just starting out, the RSO is a must-have tool for navigating market trends with confidence and precision.
Relative Strength according to Oster (RSO) is an innovative tool that redefines how traders assess an asset's market strength. Moving beyond traditional indicators, RSO offers a sophisticated and highly responsive measure of an asset's potential to continue performing well. By integrating groundbreaking methodologies, RSO equips traders with unparalleled insights into market dynamics, making it an essential tool for anyone looking to stay ahead in today's fast-paced trading environment.
Understanding RSL (Relative Strength according to Levy):
At its core, Relative Strength according to Levy (RSL) is a powerful concept rooted in the idea that an asset currently exhibiting strength is more likely to maintain or even enhance that strength in the future. RSL calculates this by comparing an asset's current price to its moving average, providing a clear picture of its relative performance over time. The further its value is above 1, the higher the market momentum and vice versa. This relationship to the moving average is crucial, as it indicates not just where the asset stands today but also its trajectory in the context of historical performance. The ability to identify assets that consistently outperform is a game-changer for traders, and RSL has long been a cornerstone in this pursuit.
RSO vs. Traditional RSL: A Leap Forward
The RSO takes the traditional RSL concept and propels it into new territory with its innovative correlation-based approach. This is where RSO truly shines, offering a unique and sophisticated analysis that goes far beyond the basics.
Why RSO is Revolutionary:
- Correlation Adjustment: The RSO doesn’t just measure an asset’s strength in isolation. Instead, it adjusts its readings based on how closely the asset's price movements correlate with a chosen benchmark. This groundbreaking feature ensures that the RSO is not just reactive to past performance but also predictive of how the asset might behave relative to the broader market, adding a layer of precision that is unparalleled in traditional strength indicators.
- Superior Strength Option: With the RSO, traders have the option to include superior strength factors, adding another dimension of insight. This feature allows for more stable and reliable long-term signals. On the flip side, those who prefer a more dynamic trading style can opt to exclude this factor for more frequent, shorter-term signals. This level of customization is rare and sets the RSO apart as a truly adaptable tool.
- Enhanced Market Insights: RSO’s correlation-based approach doesn’t just show how strong an asset is—it reveals how that strength is likely to develop in relation to the benchmark's underlying trends. This isn’t merely about comparing performance; it’s about understanding the asset’s potential trajectory in a much broader market context. Such insight is invaluable for making informed, strategic trading decisions.
Practical Application:
The RSO isn’t just innovative in theory; it’s designed for practical, real-world trading. Traders can set customized alerts based on RSO’s readings, ensuring they’re always aware of key buy or sell signals as they occur. The flexibility to include or exclude superior strength factors means that RSO can be tailored to fit any trading style, whether focused on long-term investments or short-term opportunities.
Conclusion:
In conclusion, the Relative Strength according to Oster (RSO) is more than just an indicator; it’s a breakthrough in market analysis. By integrating correlation adjustments and offering unparalleled customization options, RSO provides traders with insights that are both deeper and more actionable than ever before. This innovative tool is designed to empower traders, giving them the edge they need to succeed in an increasingly complex market landscape. Whether you’re a seasoned trader or just starting out, the RSO is a must-have tool for navigating market trends with confidence and precision.
릴리즈 노트
Alarm signals optimized (buy and sell signal); bullish and bearish areas highlighted in colour; label added to differentiate between the two RSOs릴리즈 노트
did some color adjustments릴리즈 노트
optimized superior strength릴리즈 노트
made correlation color more visible릴리즈 노트
usability improved by adding a dropdown list for benchmark릴리즈 노트
improved benchmark correlation algorithm릴리즈 노트
improved correlation algorithm again릴리즈 노트
improved usability by adding a dropdown field for symbol selection릴리즈 노트
made background color more dynamic (based on strength level)릴리즈 노트
Optimized threshold for internal correlation computations and adjusted styling릴리즈 노트
improved correlation threshold and changed default period릴리즈 노트
optimized superior strength & changed default period릴리즈 노트
added strong bearish alert and made superior strength dynamic (depending on chart-timeframe)릴리즈 노트
- Added money management feature
- Optimized alarm signals
- Improved coloring
- Inserted horizontal line at 1
릴리즈 노트
improved money management algorithm ...릴리즈 노트
fixed benchmark label bug ...릴리즈 노트
improved money management feature ...릴리즈 노트
changed default settings ...릴리즈 노트
- optimized algorithm- changed color scheme
- replaced money management feature by momentum feature
초대 전용 스크립트
이 스크립트는 작성자가 승인한 사용자만 접근할 수 있습니다. 사용하려면 요청 후 승인을 받아야 하며, 일반적으로 결제 후에 허가가 부여됩니다. 자세한 내용은 아래 작성자의 안내를 따르거나 s_i_m_o_n_s에게 직접 문의하세요.
트레이딩뷰는 스크립트의 작동 방식을 충분히 이해하고 작성자를 완전히 신뢰하지 않는 이상, 해당 스크립트에 비용을 지불하거나 사용하는 것을 권장하지 않습니다. 커뮤니티 스크립트에서 무료 오픈소스 대안을 찾아보실 수도 있습니다.
작성자 지시 사항
If you are interested in the indicator, just send me a private message and I'll give you a short test access to test it out.
면책사항
해당 정보와 게시물은 금융, 투자, 트레이딩 또는 기타 유형의 조언이나 권장 사항으로 간주되지 않으며, 트레이딩뷰에서 제공하거나 보증하는 것이 아닙니다. 자세한 내용은 이용 약관을 참조하세요.