INVITE-ONLY SCRIPT
업데이트됨 P3 Weekly Goldbach levels
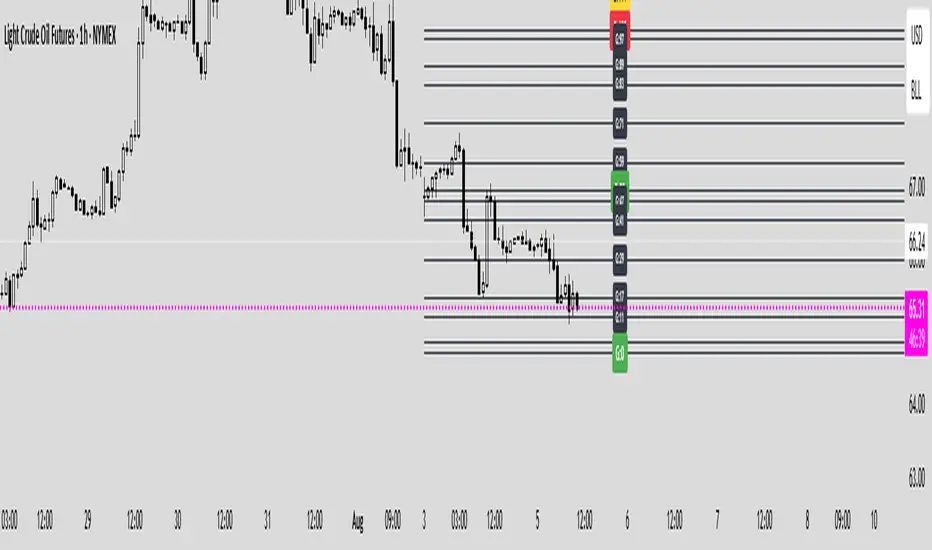
P3 Weekly Session Projections
Originality and Uniqueness:
Novel Time-Based Approach:
This indicator uniquely combines the previous weeks range analysis with mathematical Goldbach number sequences
Unlike standard Fibonacci retracements that use swing highs/lows, this script uses a specific weekly session window for consistent anchor points
The weekly reset mechanism ensures levels are always based on the most recent Sunday session, providing fresh, relevant levels
2. Mathematical Innovation:
First-of-its-kind application weekly Goldbach numbers (100, 97, 89, 83, 71, 59, 50, 47, 41, 29, 17, 11, 3, 0) as support/resistance levels
Dual-range projection system: Projects both standard deviations internally and overlays Goldbach levels for precise mathematical alignment
Auto-extending ranges when price breaks beyond 100/0 levels – automatically adds upper and lower GB ranges
3. Advanced Technical Features:
Dynamic label positioning with 4 different modes (Right Edge, Left of Line, Right of Line, Fixed Position)
Color-coded level hierarchy: Red (G:100), Green (G:0), Yellow (G:111/-111) for instant visual recognition
Session-based calculations using real market hours rather than arbitrary chart points
Clean weekly management – automatically removes previous levels and draws fresh ones each Sunday
Practical Usefulness:
1. Professional Trading Application:
Institutional session timing: plots when major institutions begin weekly positioning
Objective level placement: Eliminates subjective swing high/low selection - uses concrete session data
Multi-market applicability: Works on forex, indices, commodities, and crypto that trade during this session
2. Risk Management Benefits:
Predefined support/resistance zones based on mathematical progression rather than subjective analysis
Extension levels provide targets when price moves beyond normal ranges
Weekly refresh ensures levels remain relevant to current market structure
3. Unique Market Insights:
Goldbach number spacing provides mathematically-derived levels that often align with natural market movements
Session-based anchoring captures institutional weekly bias and positioning
Visual clarity with customizable labels and positioning for different trading styles
How It Differs from Existing Scripts:
Not a standard Fibonacci tool - uses specific mathematical sequence with weekly session anchoring
Not a generic pivot indicator - focuses on Sunday institutional session range
Not a simple support/resistance script - combines time-based analysis with mathematical projections
Not a rehash of existing indicators - genuinely novel approach combining session analysis with Goldbach mathematics
Target Audience:
Institutional traders using weekly analysis
Mathematical traders interested in number theory applications
Session-based analysts focusing on specific market opening periods
Risk management specialists needing objective level placement
This script represents genuine innovation in combining specific market session analysis with mathematical number theory, providing traders with a unique tool that doesn't exist elsewhere in the TradingView library.
릴리즈 노트
made erd, 0, 50, 100 levels bigger than others초대 전용 스크립트
이 스크립트는 작성자가 승인한 사용자만 접근할 수 있습니다. 사용하려면 요청 후 승인을 받아야 하며, 일반적으로 결제 후에 허가가 부여됩니다. 자세한 내용은 아래 작성자의 안내를 따르거나 gphidel에게 직접 문의하세요.
트레이딩뷰는 스크립트의 작동 방식을 충분히 이해하고 작성자를 완전히 신뢰하지 않는 이상, 해당 스크립트에 비용을 지불하거나 사용하는 것을 권장하지 않습니다. 커뮤니티 스크립트에서 무료 오픈소스 대안을 찾아보실 수도 있습니다.
작성자 지시 사항
please DM me your TV username for a 7 day free trial or DM me on twitter Phigo_po3
면책사항
해당 정보와 게시물은 금융, 투자, 트레이딩 또는 기타 유형의 조언이나 권장 사항으로 간주되지 않으며, 트레이딩뷰에서 제공하거나 보증하는 것이 아닙니다. 자세한 내용은 이용 약관을 참조하세요.
초대 전용 스크립트
이 스크립트는 작성자가 승인한 사용자만 접근할 수 있습니다. 사용하려면 요청 후 승인을 받아야 하며, 일반적으로 결제 후에 허가가 부여됩니다. 자세한 내용은 아래 작성자의 안내를 따르거나 gphidel에게 직접 문의하세요.
트레이딩뷰는 스크립트의 작동 방식을 충분히 이해하고 작성자를 완전히 신뢰하지 않는 이상, 해당 스크립트에 비용을 지불하거나 사용하는 것을 권장하지 않습니다. 커뮤니티 스크립트에서 무료 오픈소스 대안을 찾아보실 수도 있습니다.
작성자 지시 사항
please DM me your TV username for a 7 day free trial or DM me on twitter Phigo_po3
면책사항
해당 정보와 게시물은 금융, 투자, 트레이딩 또는 기타 유형의 조언이나 권장 사항으로 간주되지 않으며, 트레이딩뷰에서 제공하거나 보증하는 것이 아닙니다. 자세한 내용은 이용 약관을 참조하세요.