OPEN-SOURCE SCRIPT
업데이트됨 Average price in candle
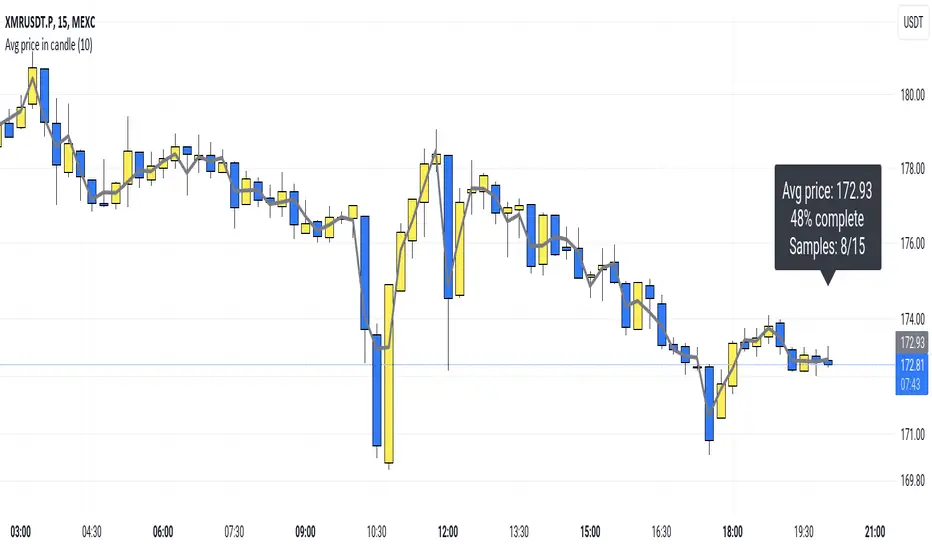
Plots the average price a security had within a candle.
So, for example: If you have a 15m candle, and price stayed near the candle's high for 10 out of the 15 minutes, you would expect the average price top be near the candle's high as well. And that's actually how it is.
(Blue 10:30 candle in the screenshot.)
I think this "average in-candle price" could be a useful thing to know. You can't gather this information from the normal chart (as you would need to go to a lower timeframe). Plus this plot can be smoother than plots of, say, closing price or hl2.
The calculation happens in a lower timeframe which is selected automatically. There is a precision selector which allows you to influence this. By default, at least 10 values are sampled for each candle.
If you have TradingView Premium, the script is able to use second-based intervals to look inside 1m candles. (Tick the corresponding checkbox to enable this.)
How it works: I collect timestamps and hl2 values from the lower timeframe. (I figure hl2 is the best choice here because a close is so arbitrary. If we don't have further information, our guess is the average is simply exactly in the middle of the candle's range.)
Then I throw the last close and current close (from the CHART timeframe) into the mix and calculate an average of the prices we collected weighted by the duration that price was in effect.
tl;dr; It's just math baby
릴리즈 노트
Made the line slightly transparent (nice if you put it in front of the candles)오픈 소스 스크립트
트레이딩뷰의 진정한 정신에 따라, 이 스크립트의 작성자는 이를 오픈소스로 공개하여 트레이더들이 기능을 검토하고 검증할 수 있도록 했습니다. 작성자에게 찬사를 보냅니다! 이 코드는 무료로 사용할 수 있지만, 코드를 재게시하는 경우 하우스 룰이 적용된다는 점을 기억하세요.
면책사항
해당 정보와 게시물은 금융, 투자, 트레이딩 또는 기타 유형의 조언이나 권장 사항으로 간주되지 않으며, 트레이딩뷰에서 제공하거나 보증하는 것이 아닙니다. 자세한 내용은 이용 약관을 참조하세요.
오픈 소스 스크립트
트레이딩뷰의 진정한 정신에 따라, 이 스크립트의 작성자는 이를 오픈소스로 공개하여 트레이더들이 기능을 검토하고 검증할 수 있도록 했습니다. 작성자에게 찬사를 보냅니다! 이 코드는 무료로 사용할 수 있지만, 코드를 재게시하는 경우 하우스 룰이 적용된다는 점을 기억하세요.
면책사항
해당 정보와 게시물은 금융, 투자, 트레이딩 또는 기타 유형의 조언이나 권장 사항으로 간주되지 않으며, 트레이딩뷰에서 제공하거나 보증하는 것이 아닙니다. 자세한 내용은 이용 약관을 참조하세요.