PROTECTED SOURCE SCRIPT
업데이트됨 LA_Periodic_Fibonacci Levels
This indicator is used to plot the previous high and low of the chosen timeframe along with the Fibonacci levels of 0.50, +/- 0.618 and +/- 0.786.
Provision is given to plot levels for three different time frames at a time.
Options are given to select/unselect the levels as per the user requirement. For plotting the Fibonacci levels of a specific period, user has to select the option "TF1_Fib" or "TF2_Fib" or "TF3_Fib" along with the respective levels (50, +/- 0.618, +/- 0.786).
User has to add different time frames in their layout which can then be used in the drop down menu. By default, daily, weekly and monthly time frames are given.
Indicator is plotted as the candle progresses and not plotted for future time frames in advance.
Below are few examples on larger timeframes.
BTCUSD on 1 min TF (timeframe)

BTCUSD on Daily TF

DJI on Daily TF

Provision is given to plot levels for three different time frames at a time.
Options are given to select/unselect the levels as per the user requirement. For plotting the Fibonacci levels of a specific period, user has to select the option "TF1_Fib" or "TF2_Fib" or "TF3_Fib" along with the respective levels (50, +/- 0.618, +/- 0.786).
User has to add different time frames in their layout which can then be used in the drop down menu. By default, daily, weekly and monthly time frames are given.
Indicator is plotted as the candle progresses and not plotted for future time frames in advance.
Below are few examples on larger timeframes.
BTCUSD on 1 min TF (timeframe)
BTCUSD on Daily TF
DJI on Daily TF
릴리즈 노트
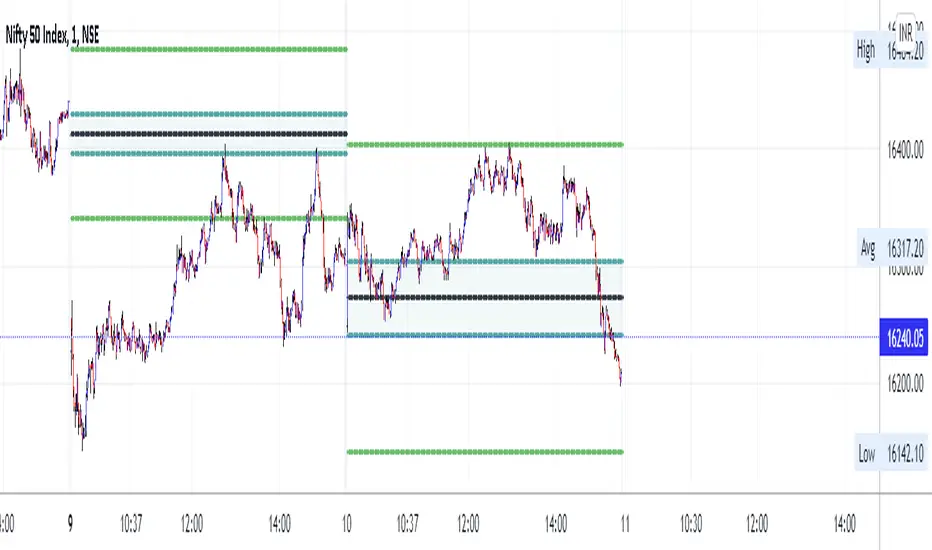
We have included the 1.272 and 1.618 levels for projections. User can select the levels accordinglyNifty50 on a Daily chart with indicator for 12 months
Nifty50 on 1min chart with indicator for 1 hour
보호된 스크립트입니다
이 스크립트는 비공개 소스로 게시됩니다. 하지만 이를 자유롭게 제한 없이 사용할 수 있습니다 – 자세한 내용은 여기에서 확인하세요.
@aravindleo_45
면책사항
해당 정보와 게시물은 금융, 투자, 트레이딩 또는 기타 유형의 조언이나 권장 사항으로 간주되지 않으며, 트레이딩뷰에서 제공하거나 보증하는 것이 아닙니다. 자세한 내용은 이용 약관을 참조하세요.
보호된 스크립트입니다
이 스크립트는 비공개 소스로 게시됩니다. 하지만 이를 자유롭게 제한 없이 사용할 수 있습니다 – 자세한 내용은 여기에서 확인하세요.
@aravindleo_45
면책사항
해당 정보와 게시물은 금융, 투자, 트레이딩 또는 기타 유형의 조언이나 권장 사항으로 간주되지 않으며, 트레이딩뷰에서 제공하거나 보증하는 것이 아닙니다. 자세한 내용은 이용 약관을 참조하세요.