OPEN-SOURCE SCRIPT
업데이트됨 Significance Condensed
// Indicator Name: "Significance Condensed"
// This is a "Multi-Indicator", which includes:
// Custom Candlesticks with Bearish/Bullish Engulfing Body Fills, otherwise hollow.
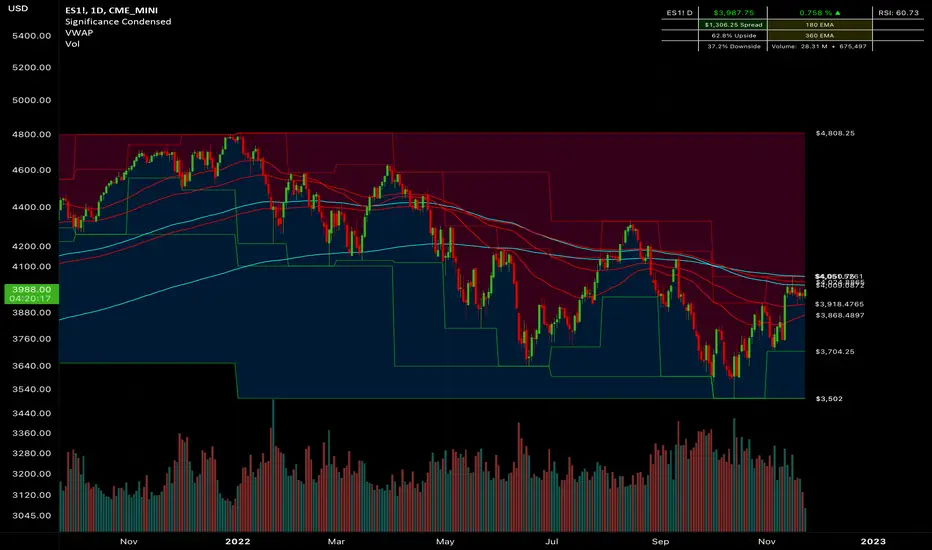
// 3 EMA's with user inputs + 2 Static EMA's
// Continuous plots of high/low values with up to 3 overlapping timeframes.
// Table: Contains the TICKER.ID, Current Price, Percent On Day (note that it does not work for extended hours charts well), Current Timeframe RSI Value(Adjustable), Spread(Difference from the Current Price to High value, 2 Static EMA displays, Upside/Downside(Percentile from Current Price to High/Low Range, respectively, and Volume(Daily Volume + Current Bar Volume)
//CANDLESTICK DISCLAIMER
// If you would like to use the custom candlestick plots, (hollow, else engulfing), that come along with this indicator,
// be sure to disable the Candlestick Body, Wick, and Border under Chart Appearance; and then enable "Candlesticks Active" in the indicator settings.
//Final Product. Finito. Done.
// This is a "Multi-Indicator", which includes:
// Custom Candlesticks with Bearish/Bullish Engulfing Body Fills, otherwise hollow.
// 3 EMA's with user inputs + 2 Static EMA's
// Continuous plots of high/low values with up to 3 overlapping timeframes.
// Table: Contains the TICKER.ID, Current Price, Percent On Day (note that it does not work for extended hours charts well), Current Timeframe RSI Value(Adjustable), Spread(Difference from the Current Price to High value, 2 Static EMA displays, Upside/Downside(Percentile from Current Price to High/Low Range, respectively, and Volume(Daily Volume + Current Bar Volume)
//CANDLESTICK DISCLAIMER
// If you would like to use the custom candlestick plots, (hollow, else engulfing), that come along with this indicator,
// be sure to disable the Candlestick Body, Wick, and Border under Chart Appearance; and then enable "Candlesticks Active" in the indicator settings.
//Final Product. Finito. Done.
릴리즈 노트
Added a tooltip to the Timeframe that is coordinated to the Spread Math on the table.Corrected a mis-titled User Ema
Corrected Timeframe Logic Flow for Ease of Understanding.
Changed some Default Colors.
Mr. Storm
Enjoy!
오픈 소스 스크립트
트레이딩뷰의 진정한 정신에 따라, 이 스크립트의 작성자는 이를 오픈소스로 공개하여 트레이더들이 기능을 검토하고 검증할 수 있도록 했습니다. 작성자에게 찬사를 보냅니다! 이 코드는 무료로 사용할 수 있지만, 코드를 재게시하는 경우 하우스 룰이 적용된다는 점을 기억하세요.
면책사항
해당 정보와 게시물은 금융, 투자, 트레이딩 또는 기타 유형의 조언이나 권장 사항으로 간주되지 않으며, 트레이딩뷰에서 제공하거나 보증하는 것이 아닙니다. 자세한 내용은 이용 약관을 참조하세요.
오픈 소스 스크립트
트레이딩뷰의 진정한 정신에 따라, 이 스크립트의 작성자는 이를 오픈소스로 공개하여 트레이더들이 기능을 검토하고 검증할 수 있도록 했습니다. 작성자에게 찬사를 보냅니다! 이 코드는 무료로 사용할 수 있지만, 코드를 재게시하는 경우 하우스 룰이 적용된다는 점을 기억하세요.
면책사항
해당 정보와 게시물은 금융, 투자, 트레이딩 또는 기타 유형의 조언이나 권장 사항으로 간주되지 않으며, 트레이딩뷰에서 제공하거나 보증하는 것이 아닙니다. 자세한 내용은 이용 약관을 참조하세요.