OPEN-SOURCE SCRIPT
업데이트됨 5MSM MAHESH 15
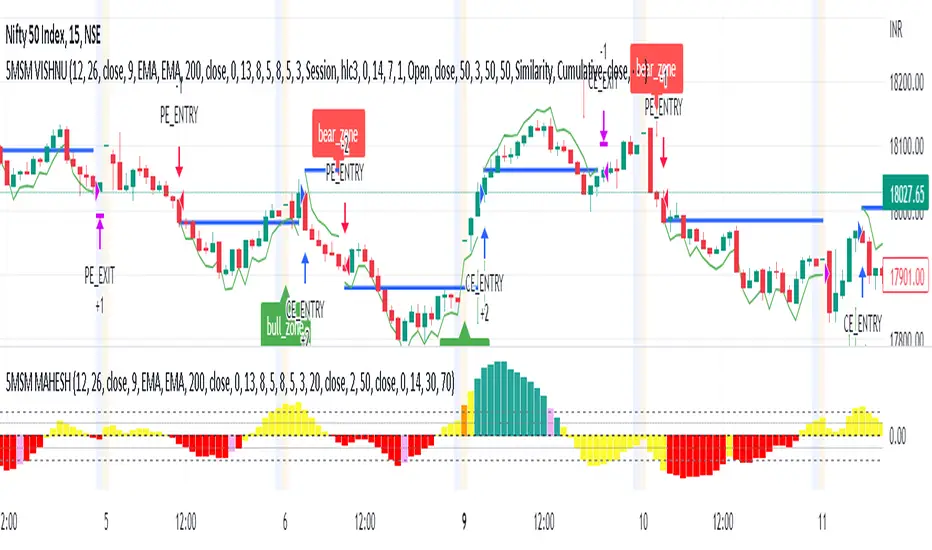
It´s just the histogram of the MACD . (Actually it´s not a histogram, I like the Area visualisation more. But you can switch.)
5min stock market property
When I´m using the MACD , I´m just searching for a divergence between Price and the MACD-histogram. I´m not interested in the MACD-signalline or the MACD-line in any way. As you can see, The omission of them leads to better visualisation. It´s much easier to spot a divergence. On the one hand because that way the histogram scales bigger, on the other hand becauce the lines can´t overdraw the histogram.
Rules bullish Divergence: Price makes a lower low, oscillator makes higher low.
Rules bearish Divergence: Price makes a higher high, oscillator makes lower high.
릴리즈 노트
possible reversal coloured in orange.릴리즈 노트
restricted reversal릴리즈 노트
RSI OB OS added릴리즈 노트
hist increased릴리즈 노트
increased histogram size릴리즈 노트
hline added for more reference오픈 소스 스크립트
트레이딩뷰의 진정한 정신에 따라, 이 스크립트의 작성자는 이를 오픈소스로 공개하여 트레이더들이 기능을 검토하고 검증할 수 있도록 했습니다. 작성자에게 찬사를 보냅니다! 이 코드는 무료로 사용할 수 있지만, 코드를 재게시하는 경우 하우스 룰이 적용된다는 점을 기억하세요.
면책사항
해당 정보와 게시물은 금융, 투자, 트레이딩 또는 기타 유형의 조언이나 권장 사항으로 간주되지 않으며, 트레이딩뷰에서 제공하거나 보증하는 것이 아닙니다. 자세한 내용은 이용 약관을 참조하세요.
오픈 소스 스크립트
트레이딩뷰의 진정한 정신에 따라, 이 스크립트의 작성자는 이를 오픈소스로 공개하여 트레이더들이 기능을 검토하고 검증할 수 있도록 했습니다. 작성자에게 찬사를 보냅니다! 이 코드는 무료로 사용할 수 있지만, 코드를 재게시하는 경우 하우스 룰이 적용된다는 점을 기억하세요.
면책사항
해당 정보와 게시물은 금융, 투자, 트레이딩 또는 기타 유형의 조언이나 권장 사항으로 간주되지 않으며, 트레이딩뷰에서 제공하거나 보증하는 것이 아닙니다. 자세한 내용은 이용 약관을 참조하세요.