INVITE-ONLY SCRIPT
업데이트됨 TM_DAY_TRACKER
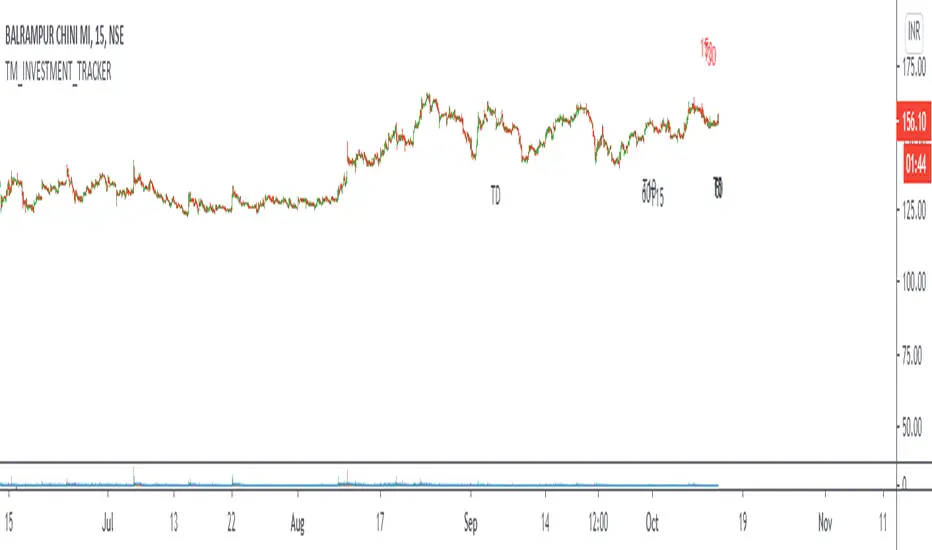
Day Tracker Indicator shows overall trend or market direction for Intraday / Swing Position along with Buy or sell signal.
Terminology Use ==> B- Buy, S- Sale Signal, and Numbers are to show timeframe indication there is presence of buyer or seller like B1 for buy signal on 1 minute timeframe etc.
Display and Interpretation ==> There are 3 lines in trend chart, line-1 light thin, line-2 dark less thick and line-3 bold thick. These lines having Green or Red color according to market signal and trend change where green for positive trend, red for negative trend
line-1 represents market strength and order build up; line-2 represents volatility or momentum ; line-3 represents market trend or direction
Timeframe ==> Use proper Signal with swing trend on 1 minute, 3 minute 5 minute, 15 minute time frame
What to Identify ==> Overall Trend for the intraday and swing Period
How to Use ==>
line-1 light thin "Green/Red" work as primary support / resistance and area of value. During the price movement price takes support or resistance here and bounce back or reverse back"
line-2 dark less thick "Green/Red" work as volatility line. This is area of volatility and direction to main trend. Price crossing above or below will give huge direction movement
line-3 bold thick "Green/Red" work as trend line or market direction line. This is area where strong or weak price will decide its direction
Note: - Use market structure, chart pattern, trend lines and price action parameter for more confirmation.
Entry ==>
Let’s wait the proper area of support or resistance ( Area of Value in case of trend pattern use)
Exit ==>
SL of swing high/low out of market structure with proper risk management and target with proper Risk/ Reward Ratio
릴리즈 노트
Updates초대 전용 스크립트
이 스크립트는 작성자가 승인한 사용자만 접근할 수 있습니다. 사용하려면 요청을 보내고 승인을 받아야 합니다. 일반적으로 결제 후에 승인이 이루어집니다. 자세한 내용은 아래 작성자의 지침을 따르거나 TradingMind24에게 직접 문의하세요.
트레이딩뷰는 스크립트 작성자를 완전히 신뢰하고 스크립트 작동 방식을 이해하지 않는 한 스크립트 비용을 지불하거나 사용하지 않는 것을 권장하지 않습니다. 무료 오픈소스 대체 스크립트는 커뮤니티 스크립트에서 찾을 수 있습니다.
작성자 지시 사항
면책사항
이 정보와 게시물은 TradingView에서 제공하거나 보증하는 금융, 투자, 거래 또는 기타 유형의 조언이나 권고 사항을 의미하거나 구성하지 않습니다. 자세한 내용은 이용 약관을 참고하세요.
초대 전용 스크립트
이 스크립트는 작성자가 승인한 사용자만 접근할 수 있습니다. 사용하려면 요청을 보내고 승인을 받아야 합니다. 일반적으로 결제 후에 승인이 이루어집니다. 자세한 내용은 아래 작성자의 지침을 따르거나 TradingMind24에게 직접 문의하세요.
트레이딩뷰는 스크립트 작성자를 완전히 신뢰하고 스크립트 작동 방식을 이해하지 않는 한 스크립트 비용을 지불하거나 사용하지 않는 것을 권장하지 않습니다. 무료 오픈소스 대체 스크립트는 커뮤니티 스크립트에서 찾을 수 있습니다.
작성자 지시 사항
면책사항
이 정보와 게시물은 TradingView에서 제공하거나 보증하는 금융, 투자, 거래 또는 기타 유형의 조언이나 권고 사항을 의미하거나 구성하지 않습니다. 자세한 내용은 이용 약관을 참고하세요.