PROTECTED SOURCE SCRIPT
업데이트됨 3D-WAVE-PM indicator
This is an extension of the WAVE-PM indicator as explained by Mark Whistler in his book Volatility Illuminated.
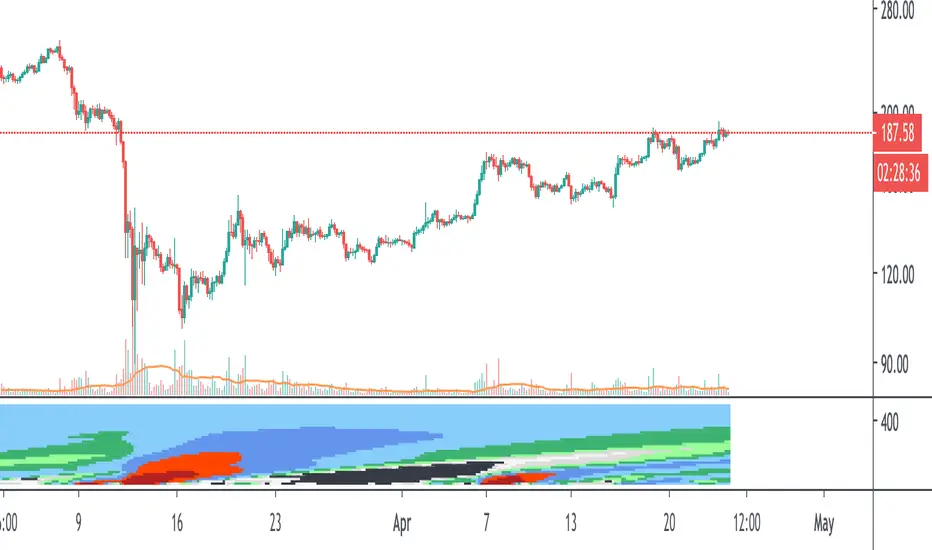
This heatmap represent different lengths of WAVE-PM indicator, starting from 20 and incremented by 15 until 485.
As a reminder, WAVE-PM compare the size of the current distribution to the last 100.
The result is represented as a number between 0 and 1.
The more close to 0, the more contracted the distribution is.
The more close to 1, the more expanded the distribution is.
The color code is the same as my standard WAVE-PM indicator :
Between 0.35 and 0.5 also known as the "Gear change" level => Grey
Between 0.5 and 0.7 also known as the "Consolidation" level => Green
Between 0.7 and 0.9 also known as the "Breakout" level => Blue
Between 0.9 and 1 also known as the "Danger" level => Red
Note that i have colored results below 0.35 as black
Note also that each level has been divided in 2 colors : The light one for the lower half of the range and the dark one for the higher half.
You should resize the indicator window to have a clear and continuous heatmap.
릴리즈 노트
- Updated to pinescript v4보호된 스크립트입니다
이 스크립트는 비공개 소스로 게시됩니다. 하지만 이를 자유롭게 제한 없이 사용할 수 있습니다 – 자세한 내용은 여기에서 확인하세요.
면책사항
해당 정보와 게시물은 금융, 투자, 트레이딩 또는 기타 유형의 조언이나 권장 사항으로 간주되지 않으며, 트레이딩뷰에서 제공하거나 보증하는 것이 아닙니다. 자세한 내용은 이용 약관을 참조하세요.
면책사항
해당 정보와 게시물은 금융, 투자, 트레이딩 또는 기타 유형의 조언이나 권장 사항으로 간주되지 않으며, 트레이딩뷰에서 제공하거나 보증하는 것이 아닙니다. 자세한 내용은 이용 약관을 참조하세요.