INVITE-ONLY SCRIPT
업데이트됨 Trendlines, Support, Resistance and Fibonacci With Alerts
Hello Traders :)
I am Only Fibonacci.
I would like to give you detailed information about this indicator that I have prepared.
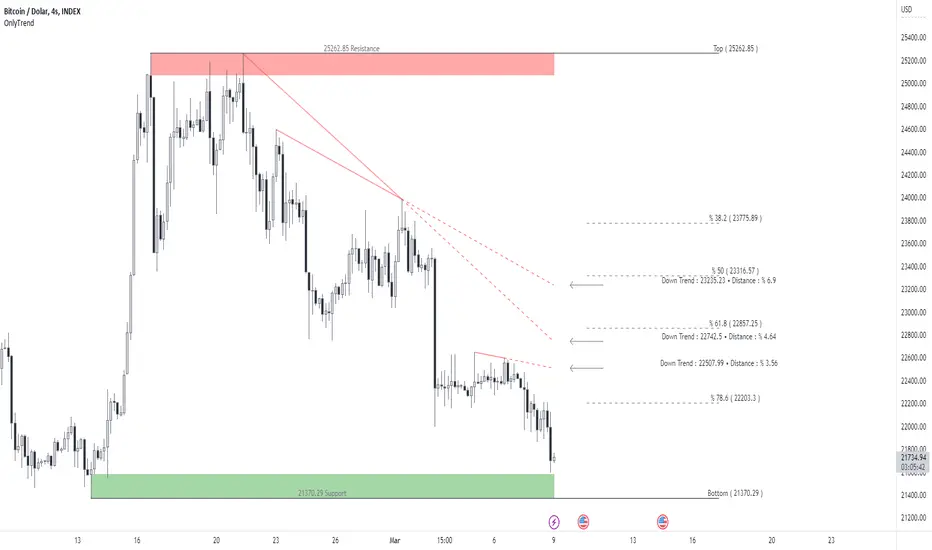
Within this indicator, you can see falling trends, rising trends, support and resistance, as well as Fibonacci levels.
I've prepared a few extra nice things for you. With this indicator, you can see the instant values of the active trend lines and their distance from the price. In my opinion, one of the best aspects of this indicator is that it can set alarms for automatically drawn trends. You can add alarms for both downtrend and uptrend.
The alarm is triggered at the break of the trend closest to the price.
Note: I do not recommend adding an alarm without thoroughly using the indicator.
We are now ready to introduce.
You can use this indicator in two languages. English and Turkish. The choice is yours.
When we enter the indicator settings, there is a group under the TRENDheading. With the settings in this group, you can determine the sensitivity of the trends to be plotted. The lower the sensitivity, the less reliable the plotted trends will be. I am sure you will find the middle ground.
Trends are calculated by relationships between all detected peaks.
If you check the Show Data box, you can see the value of the active (unbroken) trends in the current candle. Sometimes it can create visual pollution. So you can remove it. Below will be a version view where the values of the trendlines are not visible.

If you don't want to see the trends on the chart at all, uncheck the Show Trends box.
One of our subtitles is Fibonacci.
When you enter the number of bars that need to be checked backwards, it finds the highest and lowest levels in the past bars, and automatically draws fibonacci levels on the screen with a beautiful visual.
If you don't want to see Fibonacci on your chart, you can uncheck the Fibonacci Show box.
Our last topic is support and resistances.
We need a certain sensitivity setting to see support and resistance on the chart. The sensitivity setting will provide you with more realistic data. I am sure that you can adjust the correct settings in this regard as well. If you don't want to see any or both support or resistance on the chart, you can uncheck the Show Resistance or Show Support boxes.

Alarm
Active downtrends and rising trends are kept on the chart. If you want to be notified on the falling trend break closest to the price, you should choose DownTrend Breakdown.
If you want to be notified on the breakout of the rising trend closest to the price, you should choose UpTrend Breakdown.
Visuality
Downtrends are covered by a filled line between the two points. It continues with a dashed line from the second peak to the active candle. When the trend is broken, it disappears. It is red in color.
Uptrends are covered by a filled line between the two points. It continues with a dashed line from the second bottom to the active candle. When the trend is broken, it disappears. It is green in color.
The resistances are determined to cover the entire wick from the starting point to the active candle. It is red in color. It disappears when the resistance is broken.
Supports are determined to cover the entire wick from the starting point to the active candle. It is green in color. It disappears when the support is broken.
Use the link below to access this indicator.
I am Only Fibonacci.
I would like to give you detailed information about this indicator that I have prepared.
Within this indicator, you can see falling trends, rising trends, support and resistance, as well as Fibonacci levels.
I've prepared a few extra nice things for you. With this indicator, you can see the instant values of the active trend lines and their distance from the price. In my opinion, one of the best aspects of this indicator is that it can set alarms for automatically drawn trends. You can add alarms for both downtrend and uptrend.
The alarm is triggered at the break of the trend closest to the price.
Note: I do not recommend adding an alarm without thoroughly using the indicator.
We are now ready to introduce.
You can use this indicator in two languages. English and Turkish. The choice is yours.
When we enter the indicator settings, there is a group under the TRENDheading. With the settings in this group, you can determine the sensitivity of the trends to be plotted. The lower the sensitivity, the less reliable the plotted trends will be. I am sure you will find the middle ground.
Trends are calculated by relationships between all detected peaks.
If you check the Show Data box, you can see the value of the active (unbroken) trends in the current candle. Sometimes it can create visual pollution. So you can remove it. Below will be a version view where the values of the trendlines are not visible.
If you don't want to see the trends on the chart at all, uncheck the Show Trends box.
One of our subtitles is Fibonacci.
When you enter the number of bars that need to be checked backwards, it finds the highest and lowest levels in the past bars, and automatically draws fibonacci levels on the screen with a beautiful visual.
If you don't want to see Fibonacci on your chart, you can uncheck the Fibonacci Show box.
Our last topic is support and resistances.
We need a certain sensitivity setting to see support and resistance on the chart. The sensitivity setting will provide you with more realistic data. I am sure that you can adjust the correct settings in this regard as well. If you don't want to see any or both support or resistance on the chart, you can uncheck the Show Resistance or Show Support boxes.
Alarm
Active downtrends and rising trends are kept on the chart. If you want to be notified on the falling trend break closest to the price, you should choose DownTrend Breakdown.
If you want to be notified on the breakout of the rising trend closest to the price, you should choose UpTrend Breakdown.
Visuality
Downtrends are covered by a filled line between the two points. It continues with a dashed line from the second peak to the active candle. When the trend is broken, it disappears. It is red in color.
Uptrends are covered by a filled line between the two points. It continues with a dashed line from the second bottom to the active candle. When the trend is broken, it disappears. It is green in color.
The resistances are determined to cover the entire wick from the starting point to the active candle. It is red in color. It disappears when the resistance is broken.
Supports are determined to cover the entire wick from the starting point to the active candle. It is green in color. It disappears when the support is broken.
Use the link below to access this indicator.
릴리즈 노트
Colors of trend lines can be adjusted.The thickness of the trend lines can be adjusted.
The colors of the Fibonacci lines can be adjusted.
Added show/close Fibonacci lines options.
Colors of support and resistance can also be adjusted.
릴리즈 노트
Added support and resistance values on/off.릴리즈 노트
Max bars back updated.Text color editabled.
릴리즈 노트
Fibonacci levels can be adjusted릴리즈 노트
A moving average option has been added. In this way, you will be able to see the moving average you want at the top of the chart.릴리즈 노트
Added Sensitive Trends setting릴리즈 노트
Text bug fixed.릴리즈 노트
After the trend break, the number of bars that the lines will be active can be adjusted, and if desired, signs can be added to the broken regions.릴리즈 노트
After the support and resistance break, the number of bars that the lines will be active can be adjusted.릴리즈 노트
The number of violations can be entered. In this way, the number of times that can be violated in support, resistance or trends will be selected by the user.릴리즈 노트
Show Up Trend and Show Down Trend Options added.릴리즈 노트
Ma2 Add.릴리즈 노트
Alert options updated.릴리즈 노트
The minimum number of violations has been reduced.Added alarm to support and resistance breakouts.
릴리즈 노트
An update has been added to see trends in logarithmic charts.It is under development.
Consider the information in the question mark next to the LOG sign.
Check LOG when you convert the graph to logarithmic.
Uncheck LOG when you convert to linear.
릴리즈 노트
Default settings changed초대 전용 스크립트
이 스크립트는 작성자가 승인한 사용자만 접근할 수 있습니다. 사용하려면 요청 후 승인을 받아야 하며, 일반적으로 결제 후에 허가가 부여됩니다. 자세한 내용은 아래 작성자의 안내를 따르거나 only_fibonacci에게 직접 문의하세요.
트레이딩뷰는 스크립트의 작동 방식을 충분히 이해하고 작성자를 완전히 신뢰하지 않는 이상, 해당 스크립트에 비용을 지불하거나 사용하는 것을 권장하지 않습니다. 커뮤니티 스크립트에서 무료 오픈소스 대안을 찾아보실 수도 있습니다.
작성자 지시 사항
To get this indicator, please contact me at the link below.
https://twitter.com/onlyfibonacci
AlgoTrade sevdası.
면책사항
해당 정보와 게시물은 금융, 투자, 트레이딩 또는 기타 유형의 조언이나 권장 사항으로 간주되지 않으며, 트레이딩뷰에서 제공하거나 보증하는 것이 아닙니다. 자세한 내용은 이용 약관을 참조하세요.
초대 전용 스크립트
이 스크립트는 작성자가 승인한 사용자만 접근할 수 있습니다. 사용하려면 요청 후 승인을 받아야 하며, 일반적으로 결제 후에 허가가 부여됩니다. 자세한 내용은 아래 작성자의 안내를 따르거나 only_fibonacci에게 직접 문의하세요.
트레이딩뷰는 스크립트의 작동 방식을 충분히 이해하고 작성자를 완전히 신뢰하지 않는 이상, 해당 스크립트에 비용을 지불하거나 사용하는 것을 권장하지 않습니다. 커뮤니티 스크립트에서 무료 오픈소스 대안을 찾아보실 수도 있습니다.
작성자 지시 사항
To get this indicator, please contact me at the link below.
https://twitter.com/onlyfibonacci
AlgoTrade sevdası.
면책사항
해당 정보와 게시물은 금융, 투자, 트레이딩 또는 기타 유형의 조언이나 권장 사항으로 간주되지 않으며, 트레이딩뷰에서 제공하거나 보증하는 것이 아닙니다. 자세한 내용은 이용 약관을 참조하세요.