INVITE-ONLY SCRIPT
업데이트됨 SB Master Chart w/Smart Trade
This is a follow up script to the original SB Master Chart.
SB Master Chart was created to be a simple chart that can be easily interpreted.
The prior version of SB Master Chart added additional multi time frame alerts, alerting to oversold/overbought and high volume on 5 time periods (30m,1h, 2h, 4h, and 1d).
V4 of SB Master Chart is NOT going away. It is not being REPLACED!... This is a separate script based on the same algorithm, but is significantly different enough to warrant its own script. Please review SB Master Chart v4 for more details about the algo.
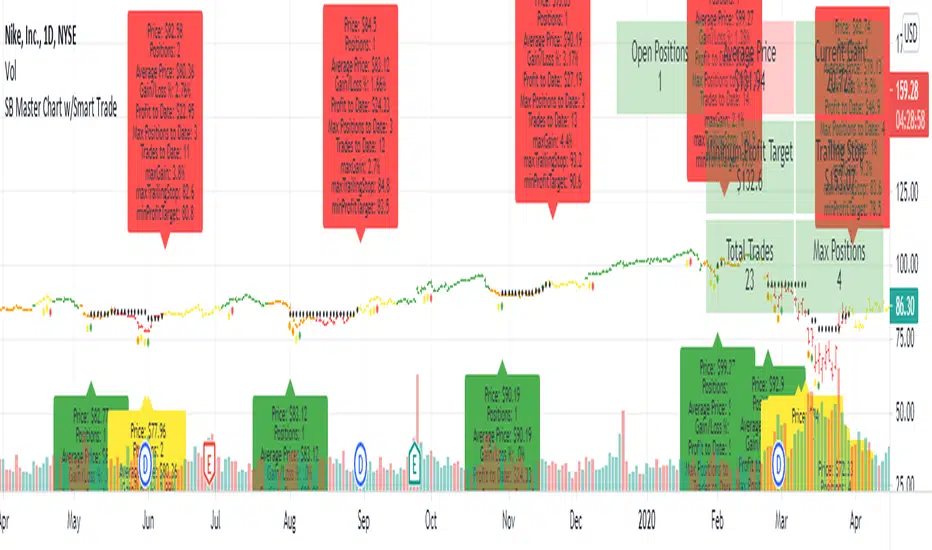
This version of SB Master Chart w/Smart Trade has additional money management parameters to help you dollar cost average in and out of a trade.
It follows the following rules
Oversold with no positions - Buy and establish a cost basis.
Oversold with positions - Only buy if below cost basis and dca percentage set in options.
Sell - Only sell if above minimum take profit and crossbelow trailing stop loss.
The script assumes you are buying and selling in lots of 1 so cost basis and positions are based on that calculation. There is a position/profit/loss table at the top of the chart.
If you don't like making trading decisions based on SB Master Chart v4, this is the chart for you, it will tell you exactly when to buy and when to sell based on the options you set. When you created the alert.
Options available
SB Master Chart was created to be a simple chart that can be easily interpreted.
The prior version of SB Master Chart added additional multi time frame alerts, alerting to oversold/overbought and high volume on 5 time periods (30m,1h, 2h, 4h, and 1d).
V4 of SB Master Chart is NOT going away. It is not being REPLACED!... This is a separate script based on the same algorithm, but is significantly different enough to warrant its own script. Please review SB Master Chart v4 for more details about the algo.
This version of SB Master Chart w/Smart Trade has additional money management parameters to help you dollar cost average in and out of a trade.
It follows the following rules
Oversold with no positions - Buy and establish a cost basis.
Oversold with positions - Only buy if below cost basis and dca percentage set in options.
Sell - Only sell if above minimum take profit and crossbelow trailing stop loss.
The script assumes you are buying and selling in lots of 1 so cost basis and positions are based on that calculation. There is a position/profit/loss table at the top of the chart.
If you don't like making trading decisions based on SB Master Chart v4, this is the chart for you, it will tell you exactly when to buy and when to sell based on the options you set. When you created the alert.
Options available
- Take Profit % - This lets you specify the minimum take profit you want to sell for.
- Trailing Stop % - This is not your typical trailing stop. This trailing stop is a percentage of the maximum gain. If your stock went up 100% and you set it to 75%, it will stop loss you out at 75% gain based on your cost basis/open trades
- DCA % - This will only open a trade if you are below your cost basis by DCA% and there is a buy signal.
- Start Year/End Year - This will allow the graph to start displaying information from the date forward. This is useful for determining Max Positions so you can calculate how much exposure each positions should have.
- Disable Trade History - This will disable the labels.
릴리즈 노트
Added better time options for start date.릴리즈 노트
Updated options (grouping).릴리즈 노트
Added risk multiplier and fixed minTakeProfit/maxTrailingStop bug.릴리즈 노트
Updated DCA Label릴리즈 노트
Added Lot Size.릴리즈 노트
Updated trailingStop to be more profitable and tighter when overbought.초대 전용 스크립트
이 스크립트는 작성자가 승인한 사용자만 접근할 수 있습니다. 사용하려면 요청을 보내고 승인을 받아야 합니다. 일반적으로 결제 후에 승인이 이루어집니다. 자세한 내용은 아래 작성자의 지침을 따르거나 StuBuzzzini에게 직접 문의하세요.
트레이딩뷰는 스크립트 작성자를 완전히 신뢰하고 스크립트 작동 방식을 이해하지 않는 한 스크립트 비용을 지불하거나 사용하지 않는 것을 권장하지 않습니다. 무료 오픈소스 대체 스크립트는 커뮤니티 스크립트에서 찾을 수 있습니다.
작성자 지시 사항
You can sign up for a free 14 day trial at my website: https://sbmasterchart.com/14-day-free-trial/ If you wish to subscribe, patreon tiers are limited. https://sbmasterchart.com/patreon
면책사항
이 정보와 게시물은 TradingView에서 제공하거나 보증하는 금융, 투자, 거래 또는 기타 유형의 조언이나 권고 사항을 의미하거나 구성하지 않습니다. 자세한 내용은 이용 약관을 참고하세요.
초대 전용 스크립트
이 스크립트는 작성자가 승인한 사용자만 접근할 수 있습니다. 사용하려면 요청을 보내고 승인을 받아야 합니다. 일반적으로 결제 후에 승인이 이루어집니다. 자세한 내용은 아래 작성자의 지침을 따르거나 StuBuzzzini에게 직접 문의하세요.
트레이딩뷰는 스크립트 작성자를 완전히 신뢰하고 스크립트 작동 방식을 이해하지 않는 한 스크립트 비용을 지불하거나 사용하지 않는 것을 권장하지 않습니다. 무료 오픈소스 대체 스크립트는 커뮤니티 스크립트에서 찾을 수 있습니다.
작성자 지시 사항
You can sign up for a free 14 day trial at my website: https://sbmasterchart.com/14-day-free-trial/ If you wish to subscribe, patreon tiers are limited. https://sbmasterchart.com/patreon
면책사항
이 정보와 게시물은 TradingView에서 제공하거나 보증하는 금융, 투자, 거래 또는 기타 유형의 조언이나 권고 사항을 의미하거나 구성하지 않습니다. 자세한 내용은 이용 약관을 참고하세요.