OPEN-SOURCE SCRIPT
Infinity Market Grid -Aynet
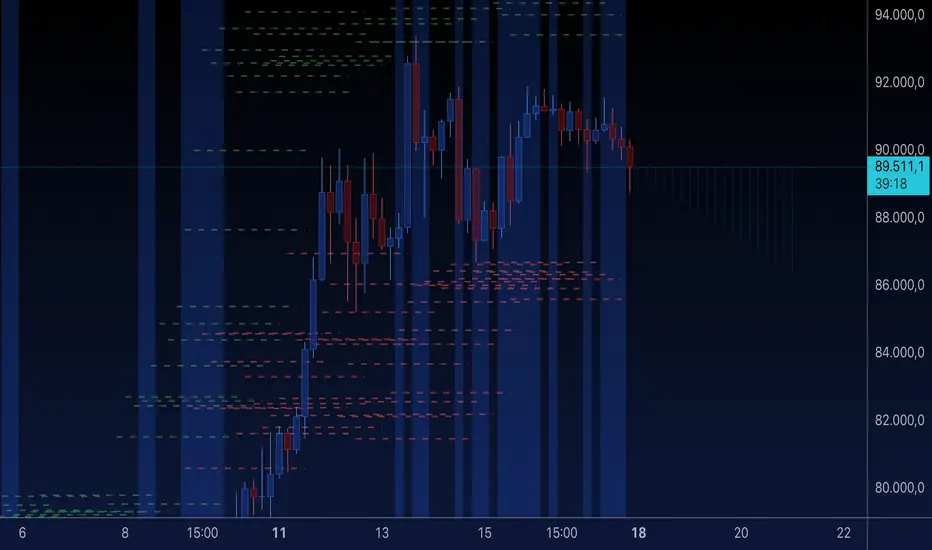
Concept
Imagine viewing the market as a dynamic grid where price, time, and momentum intersect to reveal infinite possibilities. This indicator leverages:
Grid-Based Market Flow: Visualizes price action as a grid with zones for:
Accumulation
Distribution
Breakout Expansion
Volatility Compression
Predictive Dynamic Layers:
Forecasts future price zones using historical volatility and momentum.
Tracks event probabilities like breakout, fakeout, and trend reversals.
Data Science Visuals:
Uses heatmap-style layers, moving waveforms, and price trajectory paths.
Interactive Alerts:
Real-time alerts for high-probability market events.
Marks critical zones for "buy," "sell," or "wait."
Key Features
Market Layers Grid:
Creates dynamic "boxes" around price using fractals and ATR-based volatility.
These boxes show potential future price zones and probabilities.
Volatility and Momentum Waves:
Overlay volatility oscillators and momentum bands for directional context.
Dynamic Heatmap Zones:
Colors the chart dynamically based on breakout probabilities and risk.
Price Path Prediction:
Tracks price trajectory as a moving "wave" across the grid.
How It Works
Grid Box Structure:
Upper and lower price levels are based on ATR (volatility) and plotted dynamically.
Dashed green/red lines show the grid for potential price expansion zones.
Heatmap Zones:
Colors the background based on probabilities:
Green: High breakout probability.
Blue: High consolidation probability.
Price Path Prediction:
Forecasts future price movements using momentum.
Plots these as a dynamic "wave" on the chart.
Momentum and Volatility Waves:
Shows the relationship between momentum and volatility as oscillating waves.
Helps identify when momentum exceeds volatility (potential breakouts).
Buy/Sell Signals:
Triggers when price approaches grid edges with strong momentum.
Provides alerts and visual markers.
Why Is It Revolutionary?
Grid and Wave Synergy:
Combines structural price zones (grid boxes) with real-time momentum and volatility waves.
Predictive Analytics:
Uses momentum-based forecasting to visualize what’s next, not just what’s happening.
Dynamic Heatmap:
Creates a living map of breakout/consolidation zones in real-time.
Scalable for Any Market:
Works seamlessly with forex, crypto, and stocks by adjusting the ATR multiplier and box length.
This indicator is not just a tool but a framework for understanding market dynamics at a deeper level. Let me know if you'd like to take it even further — for example, adding machine learning-inspired probability models or multi-timeframe analysis! 🚀
오픈 소스 스크립트
트레이딩뷰의 진정한 정신에 따라, 이 스크립트의 작성자는 이를 오픈소스로 공개하여 트레이더들이 기능을 검토하고 검증할 수 있도록 했습니다. 작성자에게 찬사를 보냅니다! 이 코드는 무료로 사용할 수 있지만, 코드를 재게시하는 경우 하우스 룰이 적용된다는 점을 기억하세요.
면책사항
해당 정보와 게시물은 금융, 투자, 트레이딩 또는 기타 유형의 조언이나 권장 사항으로 간주되지 않으며, 트레이딩뷰에서 제공하거나 보증하는 것이 아닙니다. 자세한 내용은 이용 약관을 참조하세요.
오픈 소스 스크립트
트레이딩뷰의 진정한 정신에 따라, 이 스크립트의 작성자는 이를 오픈소스로 공개하여 트레이더들이 기능을 검토하고 검증할 수 있도록 했습니다. 작성자에게 찬사를 보냅니다! 이 코드는 무료로 사용할 수 있지만, 코드를 재게시하는 경우 하우스 룰이 적용된다는 점을 기억하세요.
면책사항
해당 정보와 게시물은 금융, 투자, 트레이딩 또는 기타 유형의 조언이나 권장 사항으로 간주되지 않으며, 트레이딩뷰에서 제공하거나 보증하는 것이 아닙니다. 자세한 내용은 이용 약관을 참조하세요.