OPEN-SOURCE SCRIPT
Linear Regression Log Channel with 3 Standard Deviations, Alerts
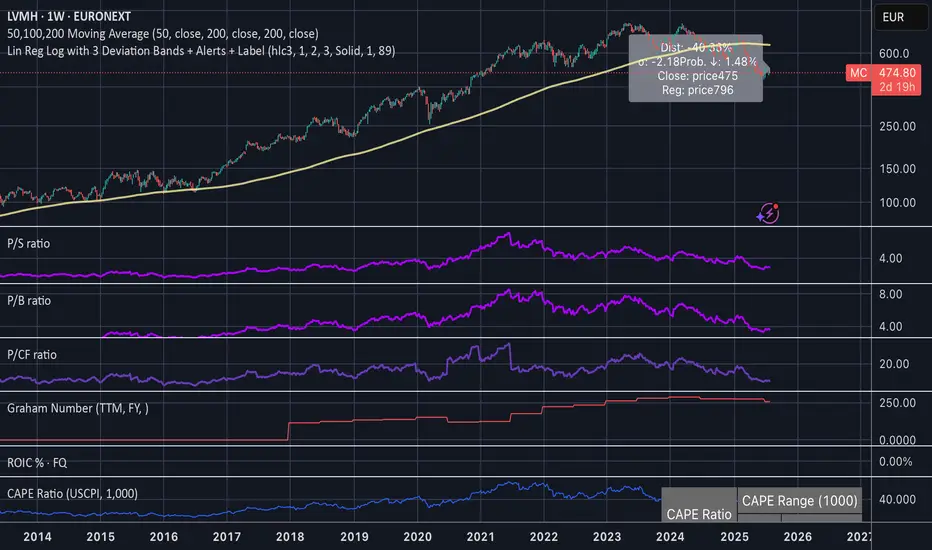
This indicator plots a logarithmic linear regression trendline starting from a user-defined date, along with ±1, ±2, and ±3 standard deviation bands. It is designed to help you visualize long-term price trends and statistically significant deviations.
Features:
• Log-scale linear regression line based on price since the selected start date
• Upper and lower bands at 1σ, 2σ, and 3σ, with the 3σ bands dashed for emphasis
• Optional filled channels between deviation bands
• Dynamic label showing:
• Distance from regression (in %)
• Distance in standard deviations (σ)
• Current price and regression value
• Estimated probability (assuming normal distribution) that the price continues moving further in its current direction
• Built-in alerts when price crosses the regression line or any of the deviation bands
This tool is useful for:
• Identifying mean-reversion setups or stretched trends
• Estimating likelihood of further directional movement
• Spotting statistically rare price conditions (e.g., >2σ or >3σ)
오픈 소스 스크립트
트레이딩뷰의 진정한 정신에 따라, 이 스크립트의 작성자는 이를 오픈소스로 공개하여 트레이더들이 기능을 검토하고 검증할 수 있도록 했습니다. 작성자에게 찬사를 보냅니다! 이 코드는 무료로 사용할 수 있지만, 코드를 재게시하는 경우 하우스 룰이 적용된다는 점을 기억하세요.
면책사항
해당 정보와 게시물은 금융, 투자, 트레이딩 또는 기타 유형의 조언이나 권장 사항으로 간주되지 않으며, 트레이딩뷰에서 제공하거나 보증하는 것이 아닙니다. 자세한 내용은 이용 약관을 참조하세요.
오픈 소스 스크립트
트레이딩뷰의 진정한 정신에 따라, 이 스크립트의 작성자는 이를 오픈소스로 공개하여 트레이더들이 기능을 검토하고 검증할 수 있도록 했습니다. 작성자에게 찬사를 보냅니다! 이 코드는 무료로 사용할 수 있지만, 코드를 재게시하는 경우 하우스 룰이 적용된다는 점을 기억하세요.
면책사항
해당 정보와 게시물은 금융, 투자, 트레이딩 또는 기타 유형의 조언이나 권장 사항으로 간주되지 않으며, 트레이딩뷰에서 제공하거나 보증하는 것이 아닙니다. 자세한 내용은 이용 약관을 참조하세요.