OPEN-SOURCE SCRIPT
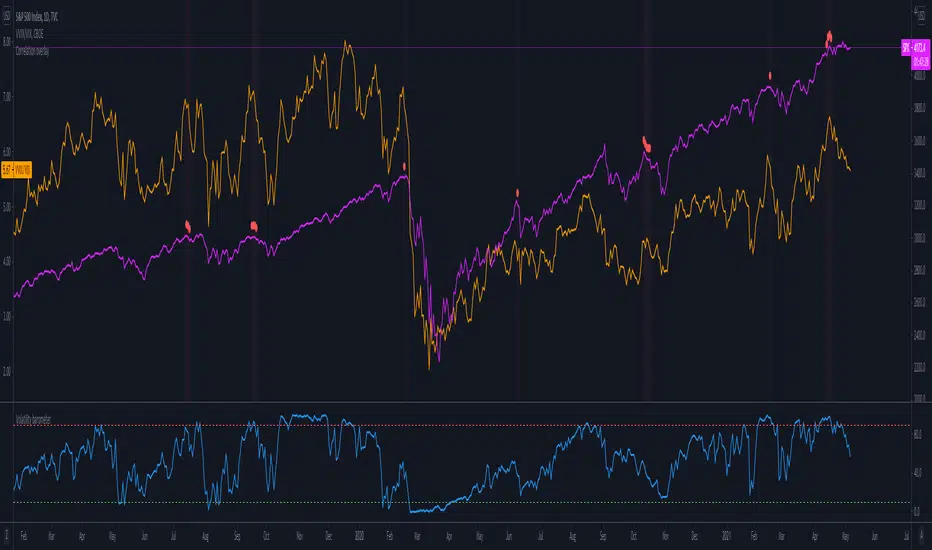
Volatility barometer

It is the indicator that analyzes the behaviour of VIX against CBOE volaility indices (VIX3M, VIX6M and VIX1Y) and VIX futures (next contract to the front one - VX!2). Because VIX is a derivate of SPX, the indicator shall be used on the SPX chart (or equivalent like SPY).
When the readings get above 90 / below 10, it means the market is overbought / oversold in terms of implied volatility. However, it does not mean it will reverse - if the price go higher along with the indicator readings then everything is fine. There is an alarming situation when the SPX is diverging - e.g. the price go higher, the readings lower. It means the SPX does not play in the same team as IVOL anymore and might reverse.
You can use it in conjunction with other implied volatility indicators for stronger signals: the Correlation overlay ( - the indicator that measures the correlation between VVIX and VIX) and VVIX/VIX ratio (it generates a signal the ratio makes 50wk high).
When the readings get above 90 / below 10, it means the market is overbought / oversold in terms of implied volatility. However, it does not mean it will reverse - if the price go higher along with the indicator readings then everything is fine. There is an alarming situation when the SPX is diverging - e.g. the price go higher, the readings lower. It means the SPX does not play in the same team as IVOL anymore and might reverse.
You can use it in conjunction with other implied volatility indicators for stronger signals: the Correlation overlay (

오픈 소스 스크립트
트레이딩뷰의 진정한 정신에 따라, 이 스크립트의 작성자는 이를 오픈소스로 공개하여 트레이더들이 기능을 검토하고 검증할 수 있도록 했습니다. 작성자에게 찬사를 보냅니다! 이 코드는 무료로 사용할 수 있지만, 코드를 재게시하는 경우 하우스 룰이 적용된다는 점을 기억하세요.
면책사항
해당 정보와 게시물은 금융, 투자, 트레이딩 또는 기타 유형의 조언이나 권장 사항으로 간주되지 않으며, 트레이딩뷰에서 제공하거나 보증하는 것이 아닙니다. 자세한 내용은 이용 약관을 참조하세요.
오픈 소스 스크립트
트레이딩뷰의 진정한 정신에 따라, 이 스크립트의 작성자는 이를 오픈소스로 공개하여 트레이더들이 기능을 검토하고 검증할 수 있도록 했습니다. 작성자에게 찬사를 보냅니다! 이 코드는 무료로 사용할 수 있지만, 코드를 재게시하는 경우 하우스 룰이 적용된다는 점을 기억하세요.
면책사항
해당 정보와 게시물은 금융, 투자, 트레이딩 또는 기타 유형의 조언이나 권장 사항으로 간주되지 않으며, 트레이딩뷰에서 제공하거나 보증하는 것이 아닙니다. 자세한 내용은 이용 약관을 참조하세요.