OPEN-SOURCE SCRIPT
업데이트됨 Horizontal Lines from Current Price
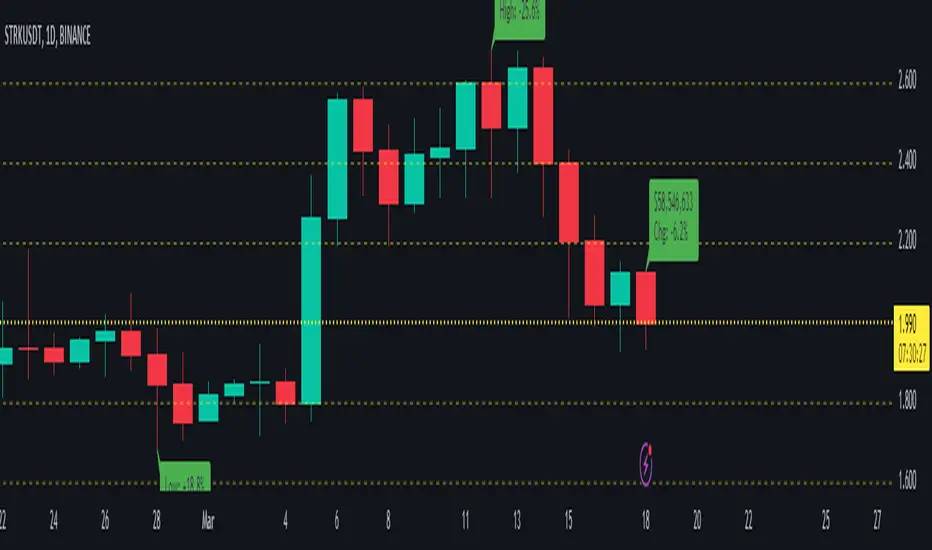
This indicator will help traders track price fluctuations in smaller time frames more conveniently than ever before.
Here's how it works:
Additionally, we also provide volume display (measured in USD) at the current candle position to assist traders in keeping track of market momentum more closely.
Installation guide for indicators:
Here's how it works:
Starting from the current price, the indicator will draw horizontal lines spaced 10% apart.
Now, whenever zooming in or out of the chart, traders can visually determine the level of price volatility more easily.
Additionally, we also provide volume display (measured in USD) at the current candle position to assist traders in keeping track of market momentum more closely.
Installation guide for indicators:
After installing the indicator, make sure that the indicator is merged with the price chart.
Secondly, ensure that the scale bar of the indicator merges with the scale bar of the price chart.
릴리즈 노트
Update default inputs릴리즈 노트
Clean source code & Inputs릴리즈 노트
➕ Added the feature to view the highest and lowest price changes of the current bar compared to the previous bars.⚡⚡⚡릴리즈 노트
Clean source code 🚧🚧🚧릴리즈 노트
➕ Added the feature to view the changes in the current price bar.⚡⚡⚡릴리즈 노트
Clean source code 🚧🚧🚧릴리즈 노트
Update display current price 🚧🚧🚧릴리즈 노트
Fix bug 🚧🚧🚧릴리즈 노트
Fix bug 🚧🚧🚧릴리즈 노트
Fix bug 🚧🚧🚧릴리즈 노트
Fix bug 🚧🚧🚧릴리즈 노트
Fix bug 🚧🚧🚧릴리즈 노트
Fix bug 🚧🚧🚧릴리즈 노트
Fix bug 🚧🚧🚧오픈 소스 스크립트
트레이딩뷰의 진정한 정신에 따라, 이 스크립트의 작성자는 이를 오픈소스로 공개하여 트레이더들이 기능을 검토하고 검증할 수 있도록 했습니다. 작성자에게 찬사를 보냅니다! 이 코드는 무료로 사용할 수 있지만, 코드를 재게시하는 경우 하우스 룰이 적용된다는 점을 기억하세요.
면책사항
해당 정보와 게시물은 금융, 투자, 트레이딩 또는 기타 유형의 조언이나 권장 사항으로 간주되지 않으며, 트레이딩뷰에서 제공하거나 보증하는 것이 아닙니다. 자세한 내용은 이용 약관을 참조하세요.
오픈 소스 스크립트
트레이딩뷰의 진정한 정신에 따라, 이 스크립트의 작성자는 이를 오픈소스로 공개하여 트레이더들이 기능을 검토하고 검증할 수 있도록 했습니다. 작성자에게 찬사를 보냅니다! 이 코드는 무료로 사용할 수 있지만, 코드를 재게시하는 경우 하우스 룰이 적용된다는 점을 기억하세요.
면책사항
해당 정보와 게시물은 금융, 투자, 트레이딩 또는 기타 유형의 조언이나 권장 사항으로 간주되지 않으며, 트레이딩뷰에서 제공하거나 보증하는 것이 아닙니다. 자세한 내용은 이용 약관을 참조하세요.