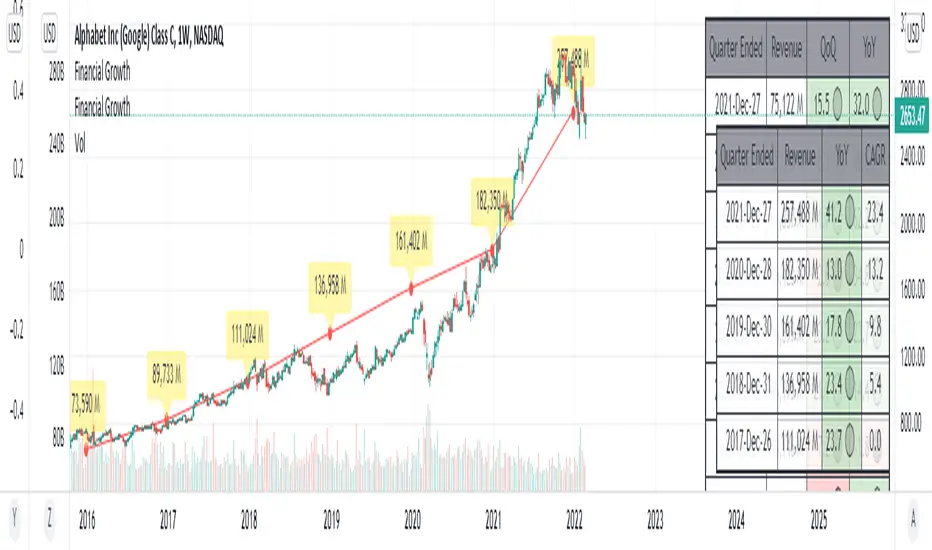
This indicator will acquire the financial data provided by Tradview.
the data is compare between Quarter, Annual and TTM in term of percent of growth.
YoY, QoQ and CAGR is also available by this script (The minimum is 4).
in addition, ploting of data, label and table also available (you can check the mark to toggle on / off).
Data : Revenue, Net Income, EBITDA, EPS, DVPS, Free Cash Flow and Forward PE .
How to use it.
just select the financial data, period and size of data to compare.
you can check the box to toggle the plotting line, label and table.
Enjoy.
릴리즈 노트
Fix comparison calculations 릴리즈 노트
- More items added. - fixed CAGR.
New Items Added
- Key Financial Number : Revenue, Net Income, EBITDA, EPS, DVPS, Free Cash Flow, Total Debt
- Key Financial Ratio : Gross Margin, EBITDA Margin, Net Margin, ROE, ROA, Price to Book Value (P/BV), Price to Earnings (P/E)
릴리즈 노트
Update Detail : 2022-Dec-17- Add 2 financial items.
- Add eps, diluted.
- Re-arrange code.
릴리즈 노트
Re-arranged code. Add more items related to debt.
릴리즈 노트
there's some problem about version.so i updated again.
오픈 소스 스크립트
트레이딩뷰의 진정한 정신에 따라, 이 스크립트의 작성자는 이를 오픈소스로 공개하여 트레이더들이 기능을 검토하고 검증할 수 있도록 했습니다. 작성자에게 찬사를 보냅니다! 이 코드는 무료로 사용할 수 있지만, 코드를 재게시하는 경우 하우스 룰이 적용된다는 점을 기억하세요.
면책사항
해당 정보와 게시물은 금융, 투자, 트레이딩 또는 기타 유형의 조언이나 권장 사항으로 간주되지 않으며, 트레이딩뷰에서 제공하거나 보증하는 것이 아닙니다. 자세한 내용은 이용 약관을 참조하세요.
오픈 소스 스크립트
트레이딩뷰의 진정한 정신에 따라, 이 스크립트의 작성자는 이를 오픈소스로 공개하여 트레이더들이 기능을 검토하고 검증할 수 있도록 했습니다. 작성자에게 찬사를 보냅니다! 이 코드는 무료로 사용할 수 있지만, 코드를 재게시하는 경우 하우스 룰이 적용된다는 점을 기억하세요.
면책사항
해당 정보와 게시물은 금융, 투자, 트레이딩 또는 기타 유형의 조언이나 권장 사항으로 간주되지 않으며, 트레이딩뷰에서 제공하거나 보증하는 것이 아닙니다. 자세한 내용은 이용 약관을 참조하세요.