OPEN-SOURCE SCRIPT
JADUGAAR_GORACHAND_V2
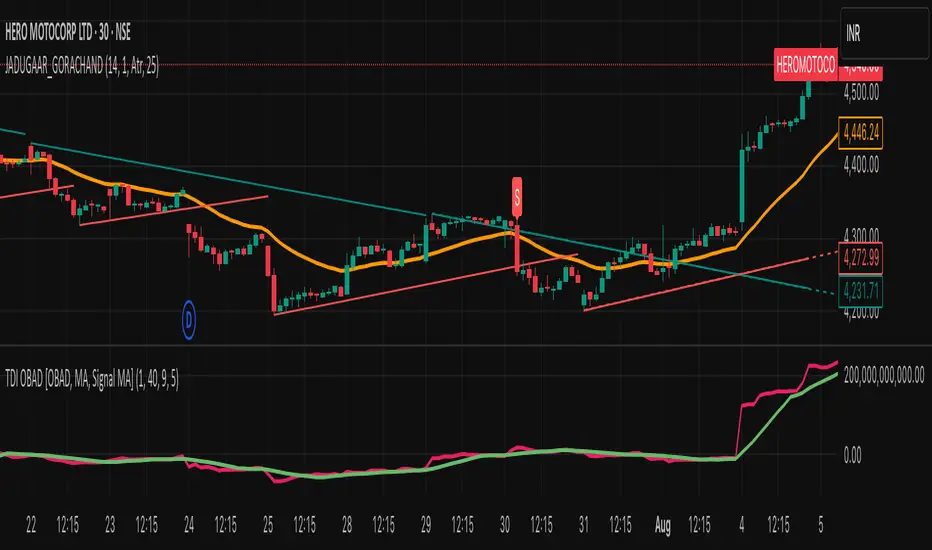
1. What is a Trendline?
A trendline is a straight line drawn on a chart that connects two or more price points. It helps visualize the direction and strength of a trend — uptrend, downtrend, or sideways.
🔼 2. Uptrend Line
An uptrend line connects higher lows. It acts as a support level, suggesting that buyers are in control. Price tends to bounce upward off this line during a bullish trend.
🔽 3. Downtrend Line
A downtrend line connects lower highs. It acts as a resistance level, indicating that sellers dominate. Price tends to fall after touching this line in a bearish trend.
🔄 4. Trendline Breaks
When price breaks a trendline, it may signal a potential trend reversal or trend weakening. Traders often use this for entry or exit signals.
📊 5. Trendline Validity
A trendline is more reliable when:
It touches 3 or more points
It's drawn over a longer time frame
There's strong volume on the breakout
오픈 소스 스크립트
트레이딩뷰의 진정한 정신에 따라, 이 스크립트의 작성자는 이를 오픈소스로 공개하여 트레이더들이 기능을 검토하고 검증할 수 있도록 했습니다. 작성자에게 찬사를 보냅니다! 이 코드는 무료로 사용할 수 있지만, 코드를 재게시하는 경우 하우스 룰이 적용된다는 점을 기억하세요.
면책사항
해당 정보와 게시물은 금융, 투자, 트레이딩 또는 기타 유형의 조언이나 권장 사항으로 간주되지 않으며, 트레이딩뷰에서 제공하거나 보증하는 것이 아닙니다. 자세한 내용은 이용 약관을 참조하세요.
오픈 소스 스크립트
트레이딩뷰의 진정한 정신에 따라, 이 스크립트의 작성자는 이를 오픈소스로 공개하여 트레이더들이 기능을 검토하고 검증할 수 있도록 했습니다. 작성자에게 찬사를 보냅니다! 이 코드는 무료로 사용할 수 있지만, 코드를 재게시하는 경우 하우스 룰이 적용된다는 점을 기억하세요.
면책사항
해당 정보와 게시물은 금융, 투자, 트레이딩 또는 기타 유형의 조언이나 권장 사항으로 간주되지 않으며, 트레이딩뷰에서 제공하거나 보증하는 것이 아닙니다. 자세한 내용은 이용 약관을 참조하세요.