PROTECTED SOURCE SCRIPT
업데이트됨 Asset Rotation System[Sahebson]
Asset Rotation System[Sahebson]
Overview
Asset Rotation System[Sahebson] is a sophisticated cross-sectional momentum strategy designed to dynamically rotate capital among a customizable selection of assets. The system continuously evaluates the relative strength of multiple assets using proprietary alpha scoring methodology, automatically positioning your portfolio in the strongest-performing asset at any given time.
This indicator provides a complete portfolio management solution for traders seeking to maximize returns through systematic asset rotation while maintaining full transparency with comprehensive performance metrics, trade history, and visual feedback.
Key Features
1. Dynamic Asset Rotation
The system continuously monitors up to 10 customizable assets across any market—stocks, crypto, forex, or commodities. Using cross-sectional analysis, it identifies the asset demonstrating the strongest relative momentum and automatically signals rotation when leadership changes.
Supports any tradable asset available on TradingView
Real-time alpha scoring for each asset
Automatic rotation signals when market leadership shifts
2. Flexible Asset Selection
Each asset slot includes an enable/disable checkbox, allowing traders to:
Quickly toggle assets in and out of the rotation universe
Test different asset combinations without reconfiguring
Adapt to changing market conditions by excluding underperforming sectors
3. Adaptive Rolling Window Strategy
The system offers four pre-configured rolling window strategies that automatically adjust based on your chart timeframe:
Conservative: Strategy Behavior Best For Conservative Very stable, fewer trades Long-term investors seeking minimal turnover
Optimal: Balanced approach Most traders seeking good trend capture with filtered noise
Aggressive: More responsive Active traders wanting to catch trends early
Very Aggressive: Highly responsive Short-term traders comfortable with higher turnover
Manual override option available for advanced users who prefer custom settings.
4. Comprehensive Performance Metrics
Real-time calculation and display of institutional-grade performance ratios:
Sharpe Ratio: Risk-adjusted returns relative to total volatility
Sortino Ratio: Downside risk-adjusted returns (penalizes only negative volatility)
Omega Ratio: Probability-weighted ratio of gains vs. losses
Maximum Drawdown: Largest peak-to-trough decline
Average Holding Period: Mean bars held per position
5. Portfolio vs. Benchmark Comparison
Side-by-side comparison of your rotating portfolio against a customizable benchmark index:
Separate equity curves for visual comparison
Color-coded metrics showing outperformance/underperformance
Real-time tracking of both portfolio and benchmark returns
6. Buy & Hold Comparison Table
Instantly compare your portfolio's performance against buy-and-hold returns for each individual asset:
See which assets would have outperformed the rotation strategy
Validate the effectiveness of dynamic allocation
Identify periods where rotation adds or subtracts value
7. Detailed Trade History
Complete trade log with:
Date and time of each rotation
Sell asset and price
Buy asset and price
P&L % per trade
Holding period (bars) for each position
Configurable display (0-30 trades)
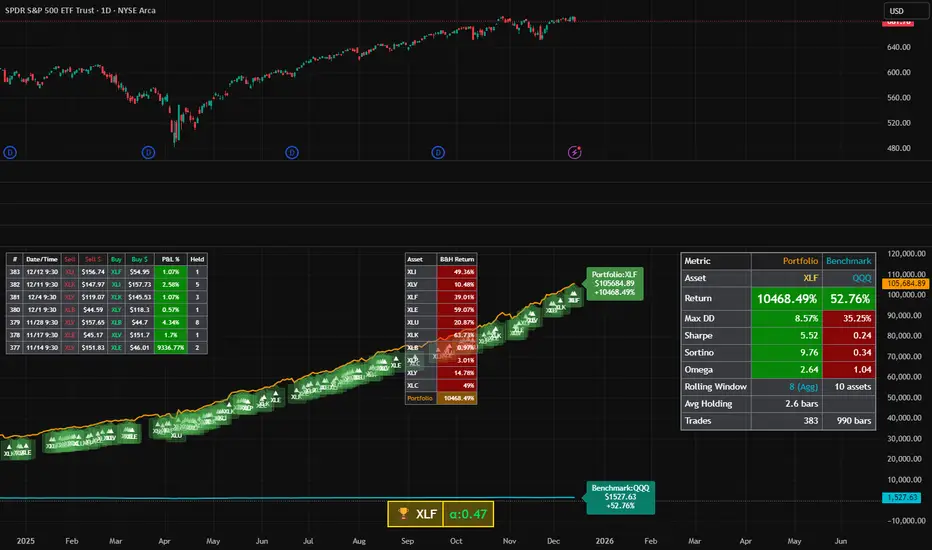
8. Visual Chart Feedback
Rotation Signals: Triangle markers with asset name when rotations occur
Portfolio Label: Current position, equity value, and return percentage
Benchmark Label: Benchmark name, equity value, and return percentage
Top Asset Box: Prominent display of current holding with alpha score
9. Flexible Back testing
Custom start date and time
Optional end date for specific period testing
Configurable starting capital
Adjustable risk-free rate for ratio calculations
Choice of 252 or 365 trading days for annualization
10. Real-Time Alerts
Automatic notifications when rotation occurs:
Alert includes sell asset, sell price, buy asset, and buy price
Compatible with TradingView's alert system
Never miss a rotation signal
************************************************************************
How to Use for Optimal Returns:
Step 1: Select Your Asset Universe
Choose assets that are:
Uncorrelated or negatively correlated: Diversification improves rotation effectiveness
Liquid: Ensures you can execute rotations without slippage
From different sectors/markets: Increases probability of finding strong performers
Step 2: Choose Your Rolling Window Strategy
Conservative, Optimal (default),Aggressive, Very Aggressive
Step 3: Set Your Timeframe
The rolling window automatically adapts to your chart timeframe:
Higher timeframes (Daily, Weekly): Smoother signals, fewer rotations, lower transaction costs
Lower timeframes (1H, 4H): More responsive, more rotations, higher potential but more noise
Recommendation: Start with Daily timeframe and Optimal strategy for most balanced results.
Step 4: Configure Backtest Period
Set start date to include various market conditions (bull, bear, sideways)
Ensure sufficient history for statistical significance (minimum 1 year recommended)
Compare metrics across different time periods to assess consistency
Step 5: Evaluate Performance
Look for:
Sharpe Ratio > 1.0: Acceptable risk-adjusted returns
Sharpe Ratio > 2.0: Very good risk-adjusted returns
Sortino Ratio > Sharpe Ratio: Strategy handles downside well
Omega Ratio > 1.5: Favorable gain/loss distribution
Portfolio Return > Benchmark: Strategy adds value vs. passive holding
Step 6: Monitor and Execute
Enable alerts for rotation notifications
Execute trades promptly when signals occur
Review trade history periodically to understand rotation patterns
Adjust asset universe if certain assets consistently underperform
Best Practices
DO:
✅ Include assets from different sectors or markets
✅ Use higher timeframes for fewer, more reliable signals
✅ Start with Conservative or Optimal strategy
✅ Backtest across multiple market conditions
✅ Consider transaction costs in your evaluation
✅ Monitor the Average Holding metric—longer holds generally mean lower costs
DON'T:
❌ Include highly correlated assets (reduces rotation benefit)
❌ Over-optimize on historical data
❌ Use Very Aggressive on low timeframes without understanding risks
❌ Ignore Maximum Drawdown—high returns with extreme drawdowns may not be sustainable
❌ Chase the highest returning backtest—consistency matters more
Performance Metrics Explained
Metric: What It Measures
Good Value Return Total: percentage gain/loss Positive
Benchmark Max DD Worst peak-to-trough decline: < 20% ideal, < 30% acceptable
Sharpe: Return per unit of total risk> 1.0 good, > 2.0 excellent
Sortino: Return per unit of downside risk> 1.5 good, > 2.5 excellent
Omega: Gain/loss probability ratio> 1.5 good, > 2.0 excellent
Avg Holding: Mean bars per position, Higher = lower turnover costs
***************************************************************************************************
Final Thoughts
Asset Rotation System[Sahebson] provides a systematic, data-driven approach to portfolio management. By dynamically allocating capital to the strongest-performing asset among your selected universe, the strategy aims to capture momentum while avoiding underperformers.
The comprehensive metrics suite allows you to evaluate not just returns, but risk-adjusted performance, ensuring you understand the true quality of your results. Whether you're managing a stock portfolio, crypto holdings, or a diversified cross-asset allocation, this indicator provides the tools needed to implement a disciplined rotation strategy.
Remember: Past performance does not guarantee future results. Always validate the strategy across multiple market conditions and consider your personal risk tolerance before trading.
Overview
Asset Rotation System[Sahebson] is a sophisticated cross-sectional momentum strategy designed to dynamically rotate capital among a customizable selection of assets. The system continuously evaluates the relative strength of multiple assets using proprietary alpha scoring methodology, automatically positioning your portfolio in the strongest-performing asset at any given time.
This indicator provides a complete portfolio management solution for traders seeking to maximize returns through systematic asset rotation while maintaining full transparency with comprehensive performance metrics, trade history, and visual feedback.
Key Features
1. Dynamic Asset Rotation
The system continuously monitors up to 10 customizable assets across any market—stocks, crypto, forex, or commodities. Using cross-sectional analysis, it identifies the asset demonstrating the strongest relative momentum and automatically signals rotation when leadership changes.
Supports any tradable asset available on TradingView
Real-time alpha scoring for each asset
Automatic rotation signals when market leadership shifts
2. Flexible Asset Selection
Each asset slot includes an enable/disable checkbox, allowing traders to:
Quickly toggle assets in and out of the rotation universe
Test different asset combinations without reconfiguring
Adapt to changing market conditions by excluding underperforming sectors
3. Adaptive Rolling Window Strategy
The system offers four pre-configured rolling window strategies that automatically adjust based on your chart timeframe:
Conservative: Strategy Behavior Best For Conservative Very stable, fewer trades Long-term investors seeking minimal turnover
Optimal: Balanced approach Most traders seeking good trend capture with filtered noise
Aggressive: More responsive Active traders wanting to catch trends early
Very Aggressive: Highly responsive Short-term traders comfortable with higher turnover
Manual override option available for advanced users who prefer custom settings.
4. Comprehensive Performance Metrics
Real-time calculation and display of institutional-grade performance ratios:
Sharpe Ratio: Risk-adjusted returns relative to total volatility
Sortino Ratio: Downside risk-adjusted returns (penalizes only negative volatility)
Omega Ratio: Probability-weighted ratio of gains vs. losses
Maximum Drawdown: Largest peak-to-trough decline
Average Holding Period: Mean bars held per position
5. Portfolio vs. Benchmark Comparison
Side-by-side comparison of your rotating portfolio against a customizable benchmark index:
Separate equity curves for visual comparison
Color-coded metrics showing outperformance/underperformance
Real-time tracking of both portfolio and benchmark returns
6. Buy & Hold Comparison Table
Instantly compare your portfolio's performance against buy-and-hold returns for each individual asset:
See which assets would have outperformed the rotation strategy
Validate the effectiveness of dynamic allocation
Identify periods where rotation adds or subtracts value
7. Detailed Trade History
Complete trade log with:
Date and time of each rotation
Sell asset and price
Buy asset and price
P&L % per trade
Holding period (bars) for each position
Configurable display (0-30 trades)
8. Visual Chart Feedback
Rotation Signals: Triangle markers with asset name when rotations occur
Portfolio Label: Current position, equity value, and return percentage
Benchmark Label: Benchmark name, equity value, and return percentage
Top Asset Box: Prominent display of current holding with alpha score
9. Flexible Back testing
Custom start date and time
Optional end date for specific period testing
Configurable starting capital
Adjustable risk-free rate for ratio calculations
Choice of 252 or 365 trading days for annualization
10. Real-Time Alerts
Automatic notifications when rotation occurs:
Alert includes sell asset, sell price, buy asset, and buy price
Compatible with TradingView's alert system
Never miss a rotation signal
************************************************************************
How to Use for Optimal Returns:
Step 1: Select Your Asset Universe
Choose assets that are:
Uncorrelated or negatively correlated: Diversification improves rotation effectiveness
Liquid: Ensures you can execute rotations without slippage
From different sectors/markets: Increases probability of finding strong performers
Step 2: Choose Your Rolling Window Strategy
Conservative, Optimal (default),Aggressive, Very Aggressive
Step 3: Set Your Timeframe
The rolling window automatically adapts to your chart timeframe:
Higher timeframes (Daily, Weekly): Smoother signals, fewer rotations, lower transaction costs
Lower timeframes (1H, 4H): More responsive, more rotations, higher potential but more noise
Recommendation: Start with Daily timeframe and Optimal strategy for most balanced results.
Step 4: Configure Backtest Period
Set start date to include various market conditions (bull, bear, sideways)
Ensure sufficient history for statistical significance (minimum 1 year recommended)
Compare metrics across different time periods to assess consistency
Step 5: Evaluate Performance
Look for:
Sharpe Ratio > 1.0: Acceptable risk-adjusted returns
Sharpe Ratio > 2.0: Very good risk-adjusted returns
Sortino Ratio > Sharpe Ratio: Strategy handles downside well
Omega Ratio > 1.5: Favorable gain/loss distribution
Portfolio Return > Benchmark: Strategy adds value vs. passive holding
Step 6: Monitor and Execute
Enable alerts for rotation notifications
Execute trades promptly when signals occur
Review trade history periodically to understand rotation patterns
Adjust asset universe if certain assets consistently underperform
Best Practices
DO:
✅ Include assets from different sectors or markets
✅ Use higher timeframes for fewer, more reliable signals
✅ Start with Conservative or Optimal strategy
✅ Backtest across multiple market conditions
✅ Consider transaction costs in your evaluation
✅ Monitor the Average Holding metric—longer holds generally mean lower costs
DON'T:
❌ Include highly correlated assets (reduces rotation benefit)
❌ Over-optimize on historical data
❌ Use Very Aggressive on low timeframes without understanding risks
❌ Ignore Maximum Drawdown—high returns with extreme drawdowns may not be sustainable
❌ Chase the highest returning backtest—consistency matters more
Performance Metrics Explained
Metric: What It Measures
Good Value Return Total: percentage gain/loss Positive
Benchmark Max DD Worst peak-to-trough decline: < 20% ideal, < 30% acceptable
Sharpe: Return per unit of total risk> 1.0 good, > 2.0 excellent
Sortino: Return per unit of downside risk> 1.5 good, > 2.5 excellent
Omega: Gain/loss probability ratio> 1.5 good, > 2.0 excellent
Avg Holding: Mean bars per position, Higher = lower turnover costs
***************************************************************************************************
Final Thoughts
Asset Rotation System[Sahebson] provides a systematic, data-driven approach to portfolio management. By dynamically allocating capital to the strongest-performing asset among your selected universe, the strategy aims to capture momentum while avoiding underperformers.
The comprehensive metrics suite allows you to evaluate not just returns, but risk-adjusted performance, ensuring you understand the true quality of your results. Whether you're managing a stock portfolio, crypto holdings, or a diversified cross-asset allocation, this indicator provides the tools needed to implement a disciplined rotation strategy.
Remember: Past performance does not guarantee future results. Always validate the strategy across multiple market conditions and consider your personal risk tolerance before trading.
릴리즈 노트
Making Dynamic Alert condition to add Buy/Sell Asset name and priceNote: You must select "Any alert() function call" to get the dynamic message with asset names and prices.
보호된 스크립트입니다
이 스크립트는 비공개 소스로 게시됩니다. 하지만 이를 자유롭게 제한 없이 사용할 수 있습니다 – 자세한 내용은 여기에서 확인하세요.
면책사항
해당 정보와 게시물은 금융, 투자, 트레이딩 또는 기타 유형의 조언이나 권장 사항으로 간주되지 않으며, 트레이딩뷰에서 제공하거나 보증하는 것이 아닙니다. 자세한 내용은 이용 약관을 참조하세요.
면책사항
해당 정보와 게시물은 금융, 투자, 트레이딩 또는 기타 유형의 조언이나 권장 사항으로 간주되지 않으며, 트레이딩뷰에서 제공하거나 보증하는 것이 아닙니다. 자세한 내용은 이용 약관을 참조하세요.