OPEN-SOURCE SCRIPT
Capiba RSI + Ichimoku + Volatilidade
The "Capiba RSI + Ichimoku + Volatility" indicator is a powerful, all-in-one technical analysis tool designed to provide traders with a comprehensive view of market dynamics directly on their price chart. This multi-layered indicator combines a custom Relative Strength Index (RSI), the trend-following Custom Ichimoku Cloud, and dynamic volatility lines to help identify high-probability trading setups.
How It Works
This indicator functions by overlaying three distinct, yet complementary, analysis systems onto a single chart, offering a clear and actionable perspective on a wide range of market conditions, from strong trends to periods of consolidation.
1. Custom RSI & Momentum Signals
The core of this indicator is a refined version of the Relative Strength Index (RSI). It calculates a custom Ultimate RSI that is more sensitive to price movements, offering a quicker response to potential shifts in momentum. The indicator also plots a moving average of this RSI, allowing for the generation of clear trading signals. Use RMAs.
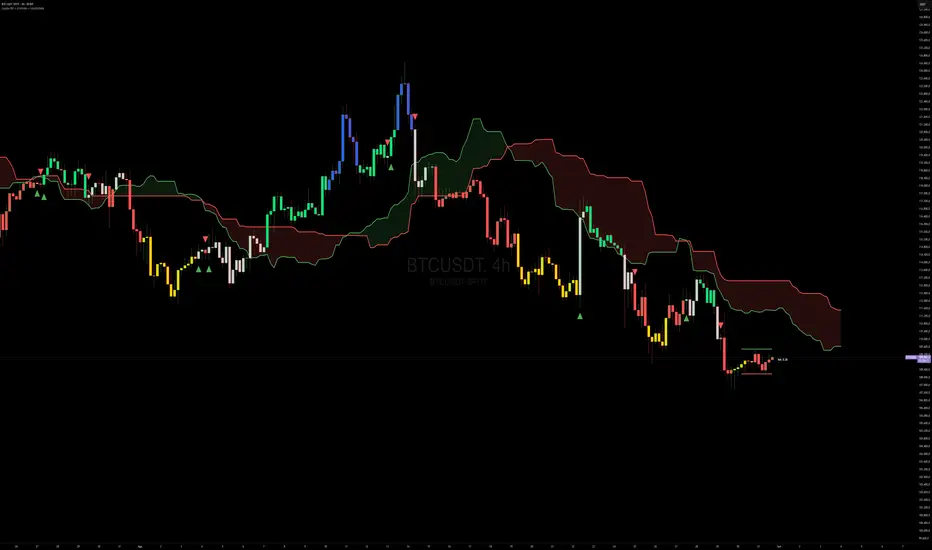
Bar Coloring: The color of the price bars on your chart dynamically changes to reflect the underlying RSI momentum.
Blue bars indicate overbought conditions, suggesting trend and a potential short-term reversal.
Yellow bars indicate oversold conditions, hinting at a potential bounce.
Green bars signal bullish momentum, where the Custom RSI is above both 50 and its own moving average.
Red bars indicate bearish momentum, as the Custom RSI is below both 50 and its moving average.
Trading Signals: The indicator plots visual signals directly on the chart in the form of triangles to highlight key entry and exit points. A green triangle appears when the Custom RSI crosses above its moving average (a buy signal), while a red triangle marks a bearish crossunder (a sell signal).
2. Custom Ichimoku Cloud for Trend Confirmation
This component plots a standard Ichimoku Cloud directly on the chart, providing a forward-looking view of trend direction, momentum, and dynamic support and resistance levels.
The cloud’s color serves as a strong visual cue for the prevailing trend: a green cloud indicates a bullish trend, while a red cloud signals a bearish trend.
The cloud itself acts as a dynamic support or resistance zone. For example, in an uptrend, prices are expected to hold above the cloud, which provides a strong support level for the market.
3. Dynamic Volatility Lines
This final layer is a dynamic volatility channel that automatically plots the highest high and lowest low from a user-defined period. These lines create a visual representation of the recent price range, helping traders understand the current market volatility.
Volatility Ratio: A label is displayed on the chart showing a volatility ratio, which compares the current price range to a historical average. A high ratio indicates increasing volatility, while a low ratio suggests a period of price consolidation or lateral movement, a valuable insight for day traders.
The indicator is highly customizable, allowing you to adjust parameters like RSI length, overbought/oversold levels, Ichimoku periods, and volatility lookback periods to suit your personal trading strategy. It is an ideal tool for traders who rely on a combination of momentum, trend, and volatility to make well-informed decisions.
How It Works
This indicator functions by overlaying three distinct, yet complementary, analysis systems onto a single chart, offering a clear and actionable perspective on a wide range of market conditions, from strong trends to periods of consolidation.
1. Custom RSI & Momentum Signals
The core of this indicator is a refined version of the Relative Strength Index (RSI). It calculates a custom Ultimate RSI that is more sensitive to price movements, offering a quicker response to potential shifts in momentum. The indicator also plots a moving average of this RSI, allowing for the generation of clear trading signals. Use RMAs.
Bar Coloring: The color of the price bars on your chart dynamically changes to reflect the underlying RSI momentum.
Blue bars indicate overbought conditions, suggesting trend and a potential short-term reversal.
Yellow bars indicate oversold conditions, hinting at a potential bounce.
Green bars signal bullish momentum, where the Custom RSI is above both 50 and its own moving average.
Red bars indicate bearish momentum, as the Custom RSI is below both 50 and its moving average.
Trading Signals: The indicator plots visual signals directly on the chart in the form of triangles to highlight key entry and exit points. A green triangle appears when the Custom RSI crosses above its moving average (a buy signal), while a red triangle marks a bearish crossunder (a sell signal).
2. Custom Ichimoku Cloud for Trend Confirmation
This component plots a standard Ichimoku Cloud directly on the chart, providing a forward-looking view of trend direction, momentum, and dynamic support and resistance levels.
The cloud’s color serves as a strong visual cue for the prevailing trend: a green cloud indicates a bullish trend, while a red cloud signals a bearish trend.
The cloud itself acts as a dynamic support or resistance zone. For example, in an uptrend, prices are expected to hold above the cloud, which provides a strong support level for the market.
3. Dynamic Volatility Lines
This final layer is a dynamic volatility channel that automatically plots the highest high and lowest low from a user-defined period. These lines create a visual representation of the recent price range, helping traders understand the current market volatility.
Volatility Ratio: A label is displayed on the chart showing a volatility ratio, which compares the current price range to a historical average. A high ratio indicates increasing volatility, while a low ratio suggests a period of price consolidation or lateral movement, a valuable insight for day traders.
The indicator is highly customizable, allowing you to adjust parameters like RSI length, overbought/oversold levels, Ichimoku periods, and volatility lookback periods to suit your personal trading strategy. It is an ideal tool for traders who rely on a combination of momentum, trend, and volatility to make well-informed decisions.
오픈 소스 스크립트
트레이딩뷰의 진정한 정신에 따라, 이 스크립트의 작성자는 이를 오픈소스로 공개하여 트레이더들이 기능을 검토하고 검증할 수 있도록 했습니다. 작성자에게 찬사를 보냅니다! 이 코드는 무료로 사용할 수 있지만, 코드를 재게시하는 경우 하우스 룰이 적용된다는 점을 기억하세요.
면책사항
해당 정보와 게시물은 금융, 투자, 트레이딩 또는 기타 유형의 조언이나 권장 사항으로 간주되지 않으며, 트레이딩뷰에서 제공하거나 보증하는 것이 아닙니다. 자세한 내용은 이용 약관을 참조하세요.
오픈 소스 스크립트
트레이딩뷰의 진정한 정신에 따라, 이 스크립트의 작성자는 이를 오픈소스로 공개하여 트레이더들이 기능을 검토하고 검증할 수 있도록 했습니다. 작성자에게 찬사를 보냅니다! 이 코드는 무료로 사용할 수 있지만, 코드를 재게시하는 경우 하우스 룰이 적용된다는 점을 기억하세요.
면책사항
해당 정보와 게시물은 금융, 투자, 트레이딩 또는 기타 유형의 조언이나 권장 사항으로 간주되지 않으며, 트레이딩뷰에서 제공하거나 보증하는 것이 아닙니다. 자세한 내용은 이용 약관을 참조하세요.