OPEN-SOURCE SCRIPT
Ultimate Gold Correlation Matrix (Extended)
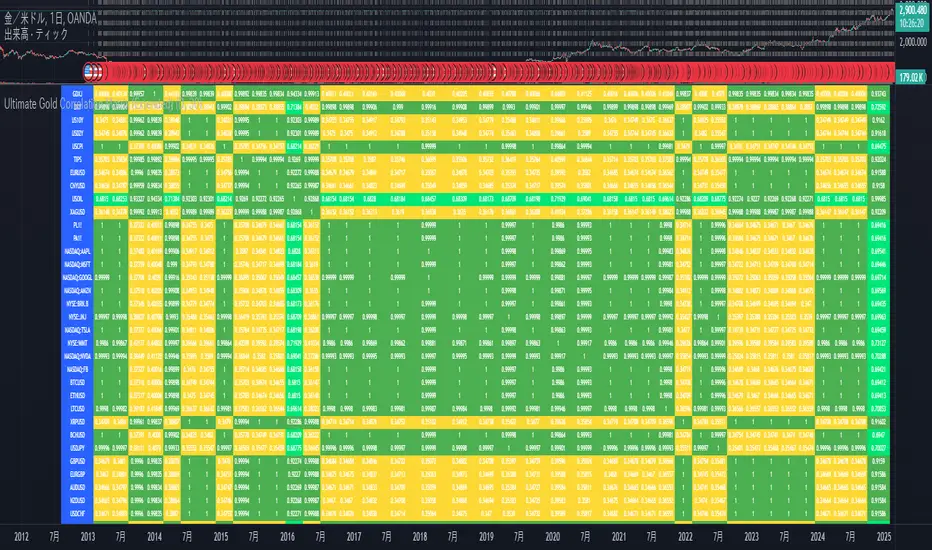
This is a correlation matrix to help you visually understand the relationship between stocks. This is the correlation of the amount of change.
The color changes depending on the value of the correlation value.
By making a node diagram of this relationship, what has been difficult to understand may become clearer.
Good luck.
1. meaning of correlation coefficient
Correlation Coefficient ranges from -1 to +1.
Correlation Coefficient Value Interpretation
+1.00 Perfect positive correlation (when one goes up, the other always goes up)
+0.75 ~ +0.99 Strong positive correlation (fairly well linked)
+0.50 ~ +0.74 Moderate positive correlation
+0.30 ~ +0.49 Weak positive correlation
-0.30 ~ +0.30 No correlation (no or weak relationship)
-0.50 ~ -0.74 Moderate negative correlation
-0.75 ~ -0.99 Strong negative correlation (when one goes up, the other goes down)
-1.00 Perfect negative correlation (opposite moves)
Translated with DeepL.com/Translator (free version)
오픈 소스 스크립트
트레이딩뷰의 진정한 정신에 따라, 이 스크립트의 작성자는 이를 오픈소스로 공개하여 트레이더들이 기능을 검토하고 검증할 수 있도록 했습니다. 작성자에게 찬사를 보냅니다! 이 코드는 무료로 사용할 수 있지만, 코드를 재게시하는 경우 하우스 룰이 적용된다는 점을 기억하세요.
면책사항
해당 정보와 게시물은 금융, 투자, 트레이딩 또는 기타 유형의 조언이나 권장 사항으로 간주되지 않으며, 트레이딩뷰에서 제공하거나 보증하는 것이 아닙니다. 자세한 내용은 이용 약관을 참조하세요.
오픈 소스 스크립트
트레이딩뷰의 진정한 정신에 따라, 이 스크립트의 작성자는 이를 오픈소스로 공개하여 트레이더들이 기능을 검토하고 검증할 수 있도록 했습니다. 작성자에게 찬사를 보냅니다! 이 코드는 무료로 사용할 수 있지만, 코드를 재게시하는 경우 하우스 룰이 적용된다는 점을 기억하세요.
면책사항
해당 정보와 게시물은 금융, 투자, 트레이딩 또는 기타 유형의 조언이나 권장 사항으로 간주되지 않으며, 트레이딩뷰에서 제공하거나 보증하는 것이 아닙니다. 자세한 내용은 이용 약관을 참조하세요.