PROTECTED SOURCE SCRIPT
업데이트됨 Unique Moving Averages
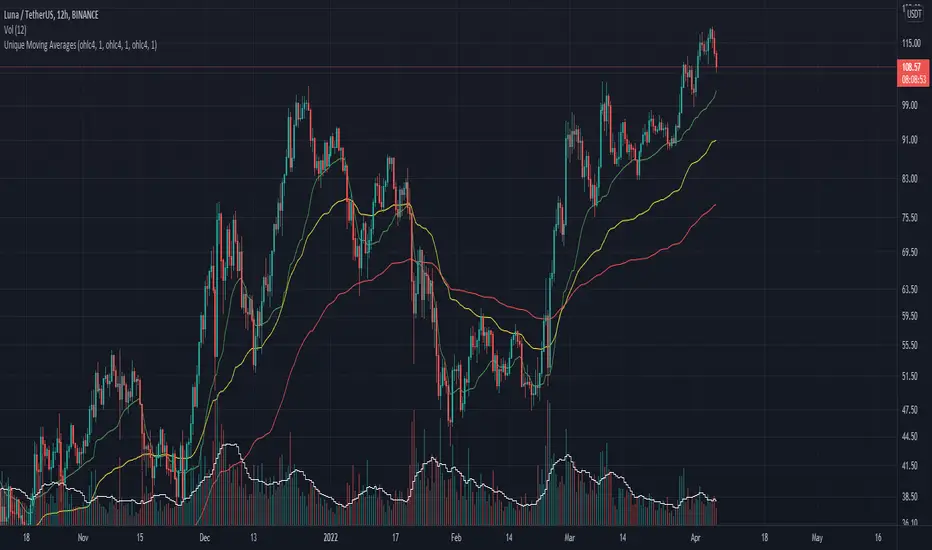
These are Unique Variable Moving Averages based off an idea from LazyBear that use volatility in determining a smoothing constant. The twist is that this script uses the extremity of a Volume based RSI reading (of various lengths for each band) to determine the length of each moving average. The potential lengths for each band increase exponentially, meaning the green band will always be faster than yellow, and yellow faster than red.
For this reason I was unable to allow user inputs to control lengths of the averages, but I did give controls to a multiplier for this function. Basically if you want them to move faster, input a value less than 1, and if you want them to move slower input a number larger than 1. I would only recommend that if you are going to change this multiplier then use the same value for all three bands.
In essence, this indicator makes needlessly complex calculations to derive these averages yet is almost overly simple to use. It uses a smoothing constant derived from volatility and then determines how closely to follow price based on volume backed price movement.
I have had success in trading the crossovers, and current backtests look promising. One of my favorite trading methods with this indicator is to pick two of the averages and trade the crossover, then use the quicker average as a trailing stop. For Example, if the yellow crosses above the red; initiate a long trade at which point the yellow line becomes the trailing stop. The same would apply for the yellow / green pair.
Let me know if you find it useful or if you have any ideas for backtesting.
Have a good day!
릴리즈 노트
Update: Changed Non-stable self referential equation to be more dynamic and follow more closely, checking the box will have it perform exactly as before보호된 스크립트입니다
이 스크립트는 비공개 소스로 게시됩니다. 하지만 제한 없이 자유롭게 사용할 수 있습니다 — 여기에서 자세히 알아보기.
면책사항
이 정보와 게시물은 TradingView에서 제공하거나 보증하는 금융, 투자, 거래 또는 기타 유형의 조언이나 권고 사항을 의미하거나 구성하지 않습니다. 자세한 내용은 이용 약관을 참고하세요.
보호된 스크립트입니다
이 스크립트는 비공개 소스로 게시됩니다. 하지만 제한 없이 자유롭게 사용할 수 있습니다 — 여기에서 자세히 알아보기.
면책사항
이 정보와 게시물은 TradingView에서 제공하거나 보증하는 금융, 투자, 거래 또는 기타 유형의 조언이나 권고 사항을 의미하거나 구성하지 않습니다. 자세한 내용은 이용 약관을 참고하세요.