PROTECTED SOURCE SCRIPT
Data Highs & Lows [TakingProphets]
DATA HIGHS AND LOWS
What it does
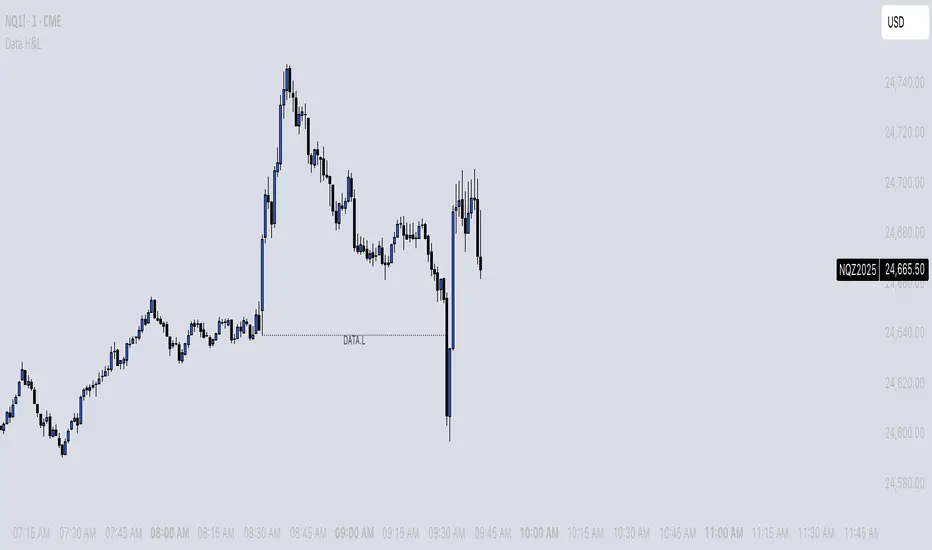
Data Highs & Lows visualizes the price level left by macro news events that release at 8:30 AM New York. It examines the 1-minute bars 8:29, 8:30, 8:31 and, if the 8:30 candle forms a valid swing low/high with a wick ≥ your threshold (points), it draws a horizontal level from that 8:30 price and labels it:
DATA.L when the 8:30 bar is a swing low
DATA.H when the 8:30 bar is a swing high
The line auto-extends until price’s wick touches/mitigates the level. On touch, you can either freeze the final segment and park the label beneath it or delete the visual immediately (toggle).
How it works
-Timezone: America/New_York.
-Detection runs on 1-minute data; visualization shows on minute charts up to 15m.
Swing rule:
-Swing-low if low(8:30) < low(8:29) and < low(8:31)
-Swing-high if high(8:30) > high(8:29) and > high(8:31)
-Wick rule: the relevant wick of the 8:30 candle must be ≥ threshold (points).
-One event/level per day; state resets daily.
Inputs & styling
Detection
-Wick Size Threshold (points).
Visualization
-Line Color, Line Style (Solid/Dashed/Dotted).
-Label Size (Tiny…Huge), Label Text Color.
-Label Vertical Offset (ticks) when parked.
-Line width is fixed at 1.
Behavior
Delete on Mitigation (remove line+label immediately on first touch) or keep the frozen level with a centered label.
Auto-cleanup after bars (optional).
Notes
-Designed to highlight levels specifically tied to 8:30 AM data releases (e.g., CPI, PPI, Jobless Claims, etc.).
-Works only if the symbol trades around that time; always consider session liquidity and instrument behavior.
-Labels: while active, they sit at the right end of the line; after mitigation they move to bottom-center with a small offset.
Disclaimer
This is an educational tool for chart annotation. It does not provide signals, guarantees, or financial advice. Always do your own analysis and manage risk appropriately.
What it does
Data Highs & Lows visualizes the price level left by macro news events that release at 8:30 AM New York. It examines the 1-minute bars 8:29, 8:30, 8:31 and, if the 8:30 candle forms a valid swing low/high with a wick ≥ your threshold (points), it draws a horizontal level from that 8:30 price and labels it:
DATA.L when the 8:30 bar is a swing low
DATA.H when the 8:30 bar is a swing high
The line auto-extends until price’s wick touches/mitigates the level. On touch, you can either freeze the final segment and park the label beneath it or delete the visual immediately (toggle).
How it works
-Timezone: America/New_York.
-Detection runs on 1-minute data; visualization shows on minute charts up to 15m.
Swing rule:
-Swing-low if low(8:30) < low(8:29) and < low(8:31)
-Swing-high if high(8:30) > high(8:29) and > high(8:31)
-Wick rule: the relevant wick of the 8:30 candle must be ≥ threshold (points).
-One event/level per day; state resets daily.
Inputs & styling
Detection
-Wick Size Threshold (points).
Visualization
-Line Color, Line Style (Solid/Dashed/Dotted).
-Label Size (Tiny…Huge), Label Text Color.
-Label Vertical Offset (ticks) when parked.
-Line width is fixed at 1.
Behavior
Delete on Mitigation (remove line+label immediately on first touch) or keep the frozen level with a centered label.
Auto-cleanup after bars (optional).
Notes
-Designed to highlight levels specifically tied to 8:30 AM data releases (e.g., CPI, PPI, Jobless Claims, etc.).
-Works only if the symbol trades around that time; always consider session liquidity and instrument behavior.
-Labels: while active, they sit at the right end of the line; after mitigation they move to bottom-center with a small offset.
Disclaimer
This is an educational tool for chart annotation. It does not provide signals, guarantees, or financial advice. Always do your own analysis and manage risk appropriately.
보호된 스크립트입니다
이 스크립트는 비공개 소스로 게시됩니다. 하지만 이를 자유롭게 제한 없이 사용할 수 있습니다 – 자세한 내용은 여기에서 확인하세요.
면책사항
해당 정보와 게시물은 금융, 투자, 트레이딩 또는 기타 유형의 조언이나 권장 사항으로 간주되지 않으며, 트레이딩뷰에서 제공하거나 보증하는 것이 아닙니다. 자세한 내용은 이용 약관을 참조하세요.
보호된 스크립트입니다
이 스크립트는 비공개 소스로 게시됩니다. 하지만 이를 자유롭게 제한 없이 사용할 수 있습니다 – 자세한 내용은 여기에서 확인하세요.
면책사항
해당 정보와 게시물은 금융, 투자, 트레이딩 또는 기타 유형의 조언이나 권장 사항으로 간주되지 않으며, 트레이딩뷰에서 제공하거나 보증하는 것이 아닙니다. 자세한 내용은 이용 약관을 참조하세요.