OPEN-SOURCE SCRIPT
Stochastic/LSMA
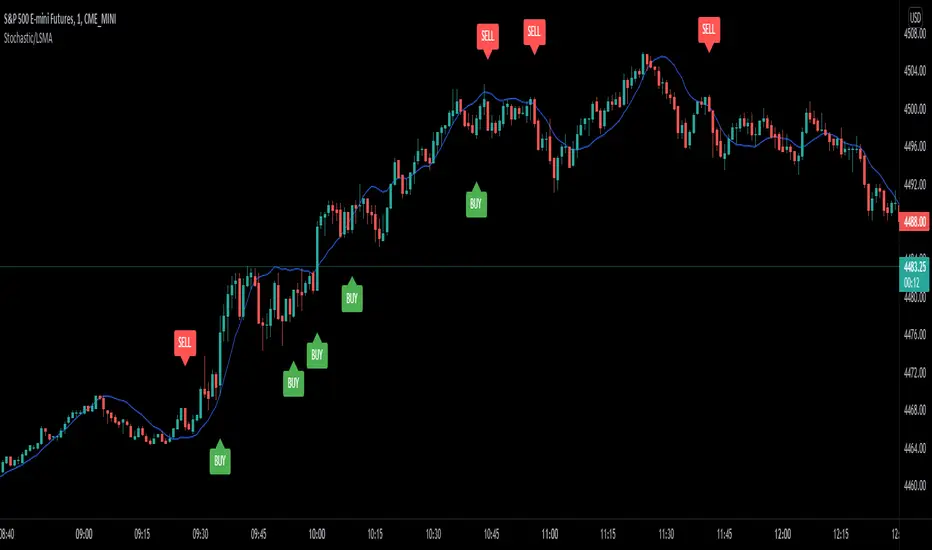
This is the Stochastic/LSMA Buy and Sell indicator. The Buy signal is generated when the %K line crosses up above the %D line from the stochastics while the signal candle is green and has come after a red candle. The Sell signal is generated when the %K line crosses down below the %D line from the stochastics while the signal candle is red and has come after a green candle. The default settings are %K Length is 5, the %K Smoothing is 3, and the %D Smoothing is 3 with the LSMA period being 30. I use this indicator to scalp 2 points at a time on the E-Mini (ES) on a 1 minute timeframe. I like to use a stop loss of 2 points and a target of 2 points. The LSMA helps to reduce fake signals and should also be used to see the overall trend. I hope this helps.
오픈 소스 스크립트
트레이딩뷰의 진정한 정신에 따라, 이 스크립트의 작성자는 이를 오픈소스로 공개하여 트레이더들이 기능을 검토하고 검증할 수 있도록 했습니다. 작성자에게 찬사를 보냅니다! 이 코드는 무료로 사용할 수 있지만, 코드를 재게시하는 경우 하우스 룰이 적용된다는 점을 기억하세요.
면책사항
해당 정보와 게시물은 금융, 투자, 트레이딩 또는 기타 유형의 조언이나 권장 사항으로 간주되지 않으며, 트레이딩뷰에서 제공하거나 보증하는 것이 아닙니다. 자세한 내용은 이용 약관을 참조하세요.
오픈 소스 스크립트
트레이딩뷰의 진정한 정신에 따라, 이 스크립트의 작성자는 이를 오픈소스로 공개하여 트레이더들이 기능을 검토하고 검증할 수 있도록 했습니다. 작성자에게 찬사를 보냅니다! 이 코드는 무료로 사용할 수 있지만, 코드를 재게시하는 경우 하우스 룰이 적용된다는 점을 기억하세요.
면책사항
해당 정보와 게시물은 금융, 투자, 트레이딩 또는 기타 유형의 조언이나 권장 사항으로 간주되지 않으며, 트레이딩뷰에서 제공하거나 보증하는 것이 아닙니다. 자세한 내용은 이용 약관을 참조하세요.