OPEN-SOURCE SCRIPT
Chaikin Volume Accumulator
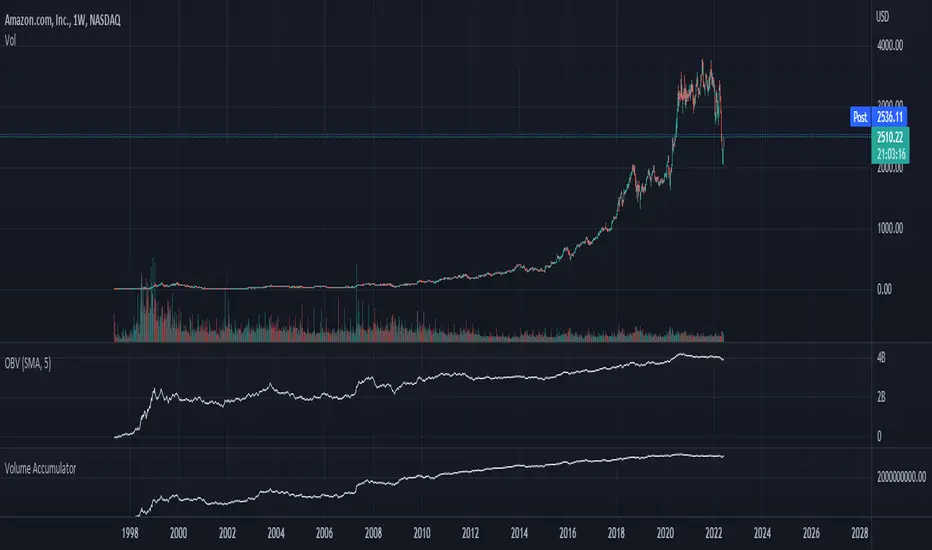
The Volume Accumulator is used in technical analysis to identify strengths and weaknesses in a market. It is derived from the On Balance Volume indicator, except that instead of giving all the volume to bears on red days and bulls on green days it gives a proportional amount to both depending on the relative close price. As with many trading indicators, classic divergence between the VA and the close price may indicate an incoming reversal.
As a general rule of thumb:
Price Up:
VA up = clear uptrend
VA sideways = moderate uptrend
VA down = weak uptrend
Price Sideways:
VA up = accumulation
VA sideways = no bias
VA down = distribution
Price Down
VA up = weak downtrend
VA sideways = moderate downtrend
VA down = strong downtrend
As a general rule of thumb:
Price Up:
VA up = clear uptrend
VA sideways = moderate uptrend
VA down = weak uptrend
Price Sideways:
VA up = accumulation
VA sideways = no bias
VA down = distribution
Price Down
VA up = weak downtrend
VA sideways = moderate downtrend
VA down = strong downtrend
오픈 소스 스크립트
트레이딩뷰의 진정한 정신에 따라, 이 스크립트의 작성자는 이를 오픈소스로 공개하여 트레이더들이 기능을 검토하고 검증할 수 있도록 했습니다. 작성자에게 찬사를 보냅니다! 이 코드는 무료로 사용할 수 있지만, 코드를 재게시하는 경우 하우스 룰이 적용된다는 점을 기억하세요.
면책사항
해당 정보와 게시물은 금융, 투자, 트레이딩 또는 기타 유형의 조언이나 권장 사항으로 간주되지 않으며, 트레이딩뷰에서 제공하거나 보증하는 것이 아닙니다. 자세한 내용은 이용 약관을 참조하세요.
오픈 소스 스크립트
트레이딩뷰의 진정한 정신에 따라, 이 스크립트의 작성자는 이를 오픈소스로 공개하여 트레이더들이 기능을 검토하고 검증할 수 있도록 했습니다. 작성자에게 찬사를 보냅니다! 이 코드는 무료로 사용할 수 있지만, 코드를 재게시하는 경우 하우스 룰이 적용된다는 점을 기억하세요.
면책사항
해당 정보와 게시물은 금융, 투자, 트레이딩 또는 기타 유형의 조언이나 권장 사항으로 간주되지 않으며, 트레이딩뷰에서 제공하거나 보증하는 것이 아닙니다. 자세한 내용은 이용 약관을 참조하세요.