OPEN-SOURCE SCRIPT
RMA EMA Crossover | MisinkoMaster
The RMA EMA Crossover (REMAC) is a trend-following overlay indicator designed to detect shifts in market momentum using the interaction between a smoothed RMA (Relative Moving Average) and its EMA (Exponential Moving Average) counterpart.
This combination provides fast, adaptive signals while reducing noise, making it suitable for a wide range of markets and timeframes.
🔎 Methodology
RMA Calculation
The Relative Moving Average (RMA) is calculated over the user-defined length.
RMA is a type of smoothed moving average that reacts more gradually than a standard EMA, providing a stable baseline.
EMA of RMA
An Exponential Moving Average (EMA) is then applied to the RMA, creating a dual-layer moving average system.
This combination amplifies trend signals while reducing false crossovers.
Trend Detection (Crossover Logic)
Bullish Signal (Trend Up) → When RMA crosses above EMA.
Bearish Signal (Trend Down) → When EMA crosses above RMA.
This simple crossover system identifies the direction of momentum shifts efficiently.
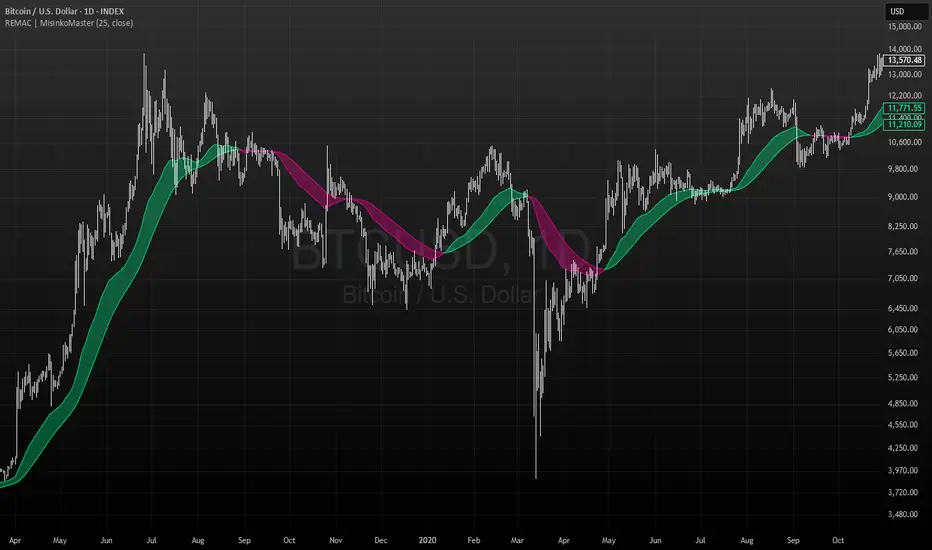
📈 Visualization
RMA and EMA are plotted directly on the chart.
Colors adapt dynamically to the current trend:
Cyan / Green hues → RMA above EMA (bullish momentum).
Magenta / Red hues → EMA above RMA (bearish momentum).
Filled areas between the two lines highlight zones of trend alignment or divergence, making it easier to spot reversals at a glance.
⚡ Features
Adjustable length parameter for RMA and EMA.
Overlay format allows for direct integration with price charts.
Visual trend scoring via color and fill for rapid assessment.
Works well across all asset classes: crypto, forex, stocks, indices.
✅ Use Cases
Trend Following → Stay on the right side of the market by following momentum shifts.
Reversal Detection → Crossovers highlight early trend changes.
Filter for Trading Systems → Use as a confirmation overlay for other indicators or strategies.
Visual Market Insight → Filled zones provide immediate context for trend strength.
This combination provides fast, adaptive signals while reducing noise, making it suitable for a wide range of markets and timeframes.
🔎 Methodology
RMA Calculation
The Relative Moving Average (RMA) is calculated over the user-defined length.
RMA is a type of smoothed moving average that reacts more gradually than a standard EMA, providing a stable baseline.
EMA of RMA
An Exponential Moving Average (EMA) is then applied to the RMA, creating a dual-layer moving average system.
This combination amplifies trend signals while reducing false crossovers.
Trend Detection (Crossover Logic)
Bullish Signal (Trend Up) → When RMA crosses above EMA.
Bearish Signal (Trend Down) → When EMA crosses above RMA.
This simple crossover system identifies the direction of momentum shifts efficiently.
📈 Visualization
RMA and EMA are plotted directly on the chart.
Colors adapt dynamically to the current trend:
Cyan / Green hues → RMA above EMA (bullish momentum).
Magenta / Red hues → EMA above RMA (bearish momentum).
Filled areas between the two lines highlight zones of trend alignment or divergence, making it easier to spot reversals at a glance.
⚡ Features
Adjustable length parameter for RMA and EMA.
Overlay format allows for direct integration with price charts.
Visual trend scoring via color and fill for rapid assessment.
Works well across all asset classes: crypto, forex, stocks, indices.
✅ Use Cases
Trend Following → Stay on the right side of the market by following momentum shifts.
Reversal Detection → Crossovers highlight early trend changes.
Filter for Trading Systems → Use as a confirmation overlay for other indicators or strategies.
Visual Market Insight → Filled zones provide immediate context for trend strength.
오픈 소스 스크립트
트레이딩뷰의 진정한 정신에 따라, 이 스크립트의 작성자는 이를 오픈소스로 공개하여 트레이더들이 기능을 검토하고 검증할 수 있도록 했습니다. 작성자에게 찬사를 보냅니다! 이 코드는 무료로 사용할 수 있지만, 코드를 재게시하는 경우 하우스 룰이 적용된다는 점을 기억하세요.
"Better to take a step back, than to stand stuck forever."
면책사항
해당 정보와 게시물은 금융, 투자, 트레이딩 또는 기타 유형의 조언이나 권장 사항으로 간주되지 않으며, 트레이딩뷰에서 제공하거나 보증하는 것이 아닙니다. 자세한 내용은 이용 약관을 참조하세요.