PROTECTED SOURCE SCRIPT
업데이트됨 Coppock Curve Correlation between MTF & Slopes
My first tool !
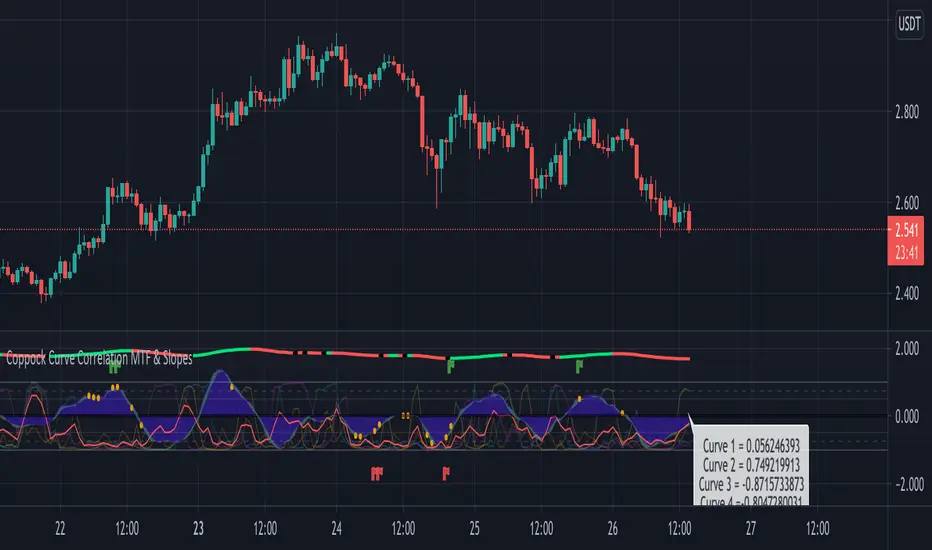
1. The waves shows the slope of the curve. The front one = 3 periods, back one = 2 periods, difference = white area.
2. The moving lines shows the curve correlation between 2x 2 time frames (adjustable on the settings) on 2 periods lookback.
2.1 Theres few regions of high correlation, lines are at (absolute values) 0.5, 0.75, 1
3. On the top there's the Coppock curve -> if falling since 1 period = red, else green.
4. Diamonds shows : if correlation is in the strong correlation area and slope is falling or rising : red or green diamond.
This tool could be interesting to have an idea if there's strong correlation between timeframes instead of watching 4-5 different timeframes !
릴리즈 노트
Changed the conditions for the diamonds to appear : -> If rising/falling and one of the correlation curve is in the strong correlation area -> then diamond !
릴리즈 노트
Update !Added :
- Possible to plot the curve choosing the timeframe.
-> 4 possible correlations of this indicator between 8 timeframes and the live values of the correlation
-> Each time all of the curves are in a zone of high correlation theres a dot plotted : if its positive high correlation : yellow dot. If it's negative high correlation : orange dot.
-> The red curve is an average of the 4 correlation curves.
-> Green or red flags : if 2/4 curves are in a high negative/positive area of high correlation and the curve is rising/falling : green or red flag. (it must be set up to be efficient, i've did a simple back test strategy for long -> with a good stop loss (5-15%) on a low time frame it's possible to reach >60-70% with a drawdown of <25-30%).
보호된 스크립트입니다
이 스크립트는 비공개 소스로 게시됩니다. 하지만 이를 자유롭게 제한 없이 사용할 수 있습니다 – 자세한 내용은 여기에서 확인하세요.
면책사항
해당 정보와 게시물은 금융, 투자, 트레이딩 또는 기타 유형의 조언이나 권장 사항으로 간주되지 않으며, 트레이딩뷰에서 제공하거나 보증하는 것이 아닙니다. 자세한 내용은 이용 약관을 참조하세요.
보호된 스크립트입니다
이 스크립트는 비공개 소스로 게시됩니다. 하지만 이를 자유롭게 제한 없이 사용할 수 있습니다 – 자세한 내용은 여기에서 확인하세요.
면책사항
해당 정보와 게시물은 금융, 투자, 트레이딩 또는 기타 유형의 조언이나 권장 사항으로 간주되지 않으며, 트레이딩뷰에서 제공하거나 보증하는 것이 아닙니다. 자세한 내용은 이용 약관을 참조하세요.