OPEN-SOURCE SCRIPT
Gold scalper 1 min or 30 sec
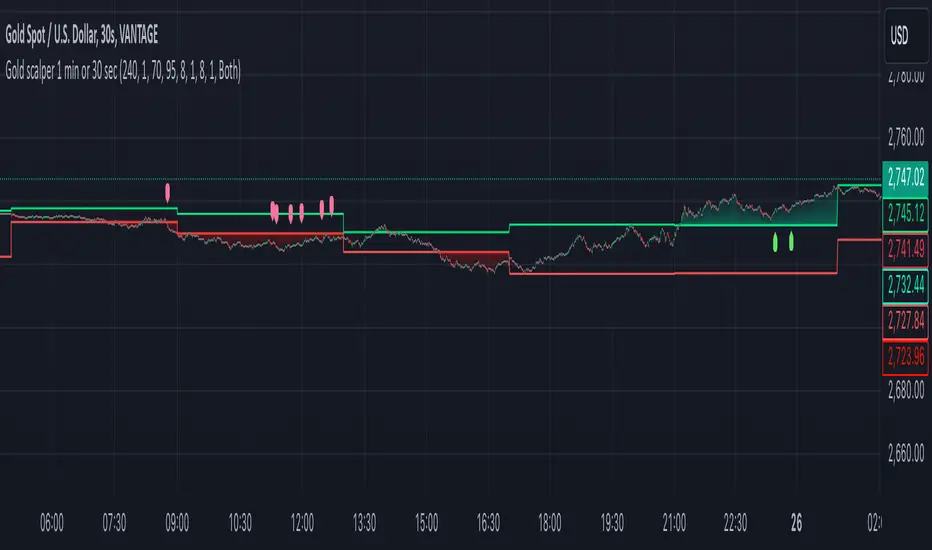
This Pine Script code for TradingView is designed to create a trading indicator titled "Gold scalper 1 min or 30 sec." The indicator is primarily used for scalping gold and is focused on short-term timeframes (1 minute or 30 seconds).
### Key Components of the Code:
1. **Inputs:**
- **Resolution:** Users can set the timeframe for analysis (default is 240 minutes).
- **SMA (Simple Moving Average):** Users can specify the period for the SMA used in the calculations.
2. **Daily Highs and Lows:**
- The script calculates the previous day’s high (`yesterdayHigh`) and low (`yesterdayLow`) prices using the `request.security` function.
3. **SMA Calculation:**
- An SMA is computed based on the closing prices of the selected timeframe.
4. **Breakout Conditions:**
- The script detects breakouts using the SMA in relation to yesterday's high and low:
- A breakout upwards occurs when the SMA crosses above the previous day's high.
- A breakout downwards occurs when the SMA crosses below the previous day's low.
5. **RSI (Relative Strength Index) Calculations:**
- Two RSI values are calculated to assess market momentum:
- **Banker RSI:** Used for buy conditions.
- **Hot Money RSI:** Used for sell conditions.
- These include adjustable sensitivity factors and periods to customize the indicator’s sensitivity.
6. **Trade Direction Selection:**
- Users can select whether to trade long, short, or both directions.
7. **Buy and Sell Signals:**
- Buy conditions are set when the Retail Moving Average crosses the Banker Moving Average under certain conditions.
- Sell conditions are marked when the Banker Moving Average crosses under the specified sell threshold.
- These signals are visually represented on the chart with specific shapes (up arrows for buys and down arrows for sells).
8. **Alerts:**
- Alerts are generated for buy and sell signals to notify users when certain conditions are met.
9. **Trend Visualization:**
- The script visually indicates uptrends and downtrends on the chart by plotting colors based on the relationship between the current price, yesterday's high, and low.
### General Purpose:
This indicator is designed to assist traders in identifying potential buying and selling opportunities in the gold market based on short-term price movements and momentum indicators, helping them capitalize on quick price fluctuations that are characteristic of scalping strategies.
오픈 소스 스크립트
트레이딩뷰의 진정한 정신에 따라, 이 스크립트의 작성자는 이를 오픈소스로 공개하여 트레이더들이 기능을 검토하고 검증할 수 있도록 했습니다. 작성자에게 찬사를 보냅니다! 이 코드는 무료로 사용할 수 있지만, 코드를 재게시하는 경우 하우스 룰이 적용된다는 점을 기억하세요.
면책사항
해당 정보와 게시물은 금융, 투자, 트레이딩 또는 기타 유형의 조언이나 권장 사항으로 간주되지 않으며, 트레이딩뷰에서 제공하거나 보증하는 것이 아닙니다. 자세한 내용은 이용 약관을 참조하세요.
오픈 소스 스크립트
트레이딩뷰의 진정한 정신에 따라, 이 스크립트의 작성자는 이를 오픈소스로 공개하여 트레이더들이 기능을 검토하고 검증할 수 있도록 했습니다. 작성자에게 찬사를 보냅니다! 이 코드는 무료로 사용할 수 있지만, 코드를 재게시하는 경우 하우스 룰이 적용된다는 점을 기억하세요.
면책사항
해당 정보와 게시물은 금융, 투자, 트레이딩 또는 기타 유형의 조언이나 권장 사항으로 간주되지 않으며, 트레이딩뷰에서 제공하거나 보증하는 것이 아닙니다. 자세한 내용은 이용 약관을 참조하세요.