OPEN-SOURCE SCRIPT
Dynamic Open Levels
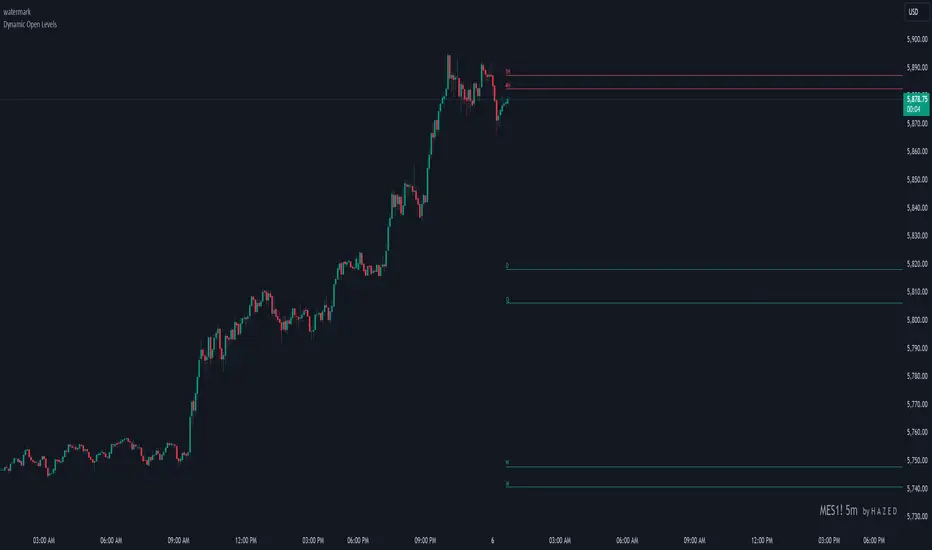
# Dynamic Open Levels Indicator v1.0
Release Date: November 5, 2024
Introducing the Dynamic Open Levels indicator on TradingView! This tool helps traders visualize and analyze key opening price levels across multiple timeframes, making your market analysis more effective.
---
### Key Features
- Multiple Timeframes: Yearly, Quarterly, Monthly, Weekly, Daily, 4H, and 1H levels available.
- Visibility Controls: Easily toggle visibility for each timeframe to suit your trading style.
- Line Customization: Set custom thickness and colors for lines, making charts easy to interpret.
- Monthly: Purple
- Weekly: Blue
- Daily: Green
- 4H: Red
- 1H: Orange
- Dynamic Coloring: Lines adjust color based on market conditions—teal for bullish (`rgb(34, 171, 148)`) and coral for bearish (`rgb(247, 82, 95)`).
### Labels & Customization
- Real-Time Labels: Each level is labeled for easy identification (e.g., Y for Yearly, Q for Quarterly).
- Label Settings: Customize opacity, text color, size, and position for clarity without cluttering your chart.
- Sizes: Choose from tiny, small, normal, large, to huge.
- Offset: Set labels from 1 to 10 to position them precisely.
- Color Management: Organize all colors under a dedicated Line Colors group for easy adjustments.
### Advanced Plotting & Performance
- Real-Time Updates: Levels are updated dynamically with the latest open prices.
- Extended Lines: Lines extend to the right, offering a consistent reference for future price movement.
- Optimized Performance: Handles up to 500 lines efficiently to maintain smooth performance.
---
### Installation Instructions
1. Add to Chart:
- Go to the Indicators section in TradingView.
- Search for Dynamic Open Levels and add it to your chart.
2. Customize Settings:
- Line Thickness: Adjust to suit your preference.
- Visibility: Toggle timeframes like Yearly, Monthly, Weekly, etc., as needed.
- Labels: Configure opacity, text color, size, and offset under the Label Settings group.
---
### Documentation & Support
For guidance on using the Dynamic Open Levels indicator, visit our Documentation(#). If you need assistance, check out our Support Channel(#).
---
Thank you for choosing Dynamic Open Levels. Stay tuned for future updates that will continue to improve your trading experience!
H A Z E D
오픈 소스 스크립트
트레이딩뷰의 진정한 정신에 따라, 이 스크립트의 작성자는 이를 오픈소스로 공개하여 트레이더들이 기능을 검토하고 검증할 수 있도록 했습니다. 작성자에게 찬사를 보냅니다! 이 코드는 무료로 사용할 수 있지만, 코드를 재게시하는 경우 하우스 룰이 적용된다는 점을 기억하세요.
면책사항
해당 정보와 게시물은 금융, 투자, 트레이딩 또는 기타 유형의 조언이나 권장 사항으로 간주되지 않으며, 트레이딩뷰에서 제공하거나 보증하는 것이 아닙니다. 자세한 내용은 이용 약관을 참조하세요.
오픈 소스 스크립트
트레이딩뷰의 진정한 정신에 따라, 이 스크립트의 작성자는 이를 오픈소스로 공개하여 트레이더들이 기능을 검토하고 검증할 수 있도록 했습니다. 작성자에게 찬사를 보냅니다! 이 코드는 무료로 사용할 수 있지만, 코드를 재게시하는 경우 하우스 룰이 적용된다는 점을 기억하세요.
면책사항
해당 정보와 게시물은 금융, 투자, 트레이딩 또는 기타 유형의 조언이나 권장 사항으로 간주되지 않으며, 트레이딩뷰에서 제공하거나 보증하는 것이 아닙니다. 자세한 내용은 이용 약관을 참조하세요.