OPEN-SOURCE SCRIPT
업데이트됨 Ultimate Bands [BigBeluga]

Ultimate Bands [BigBeluga]
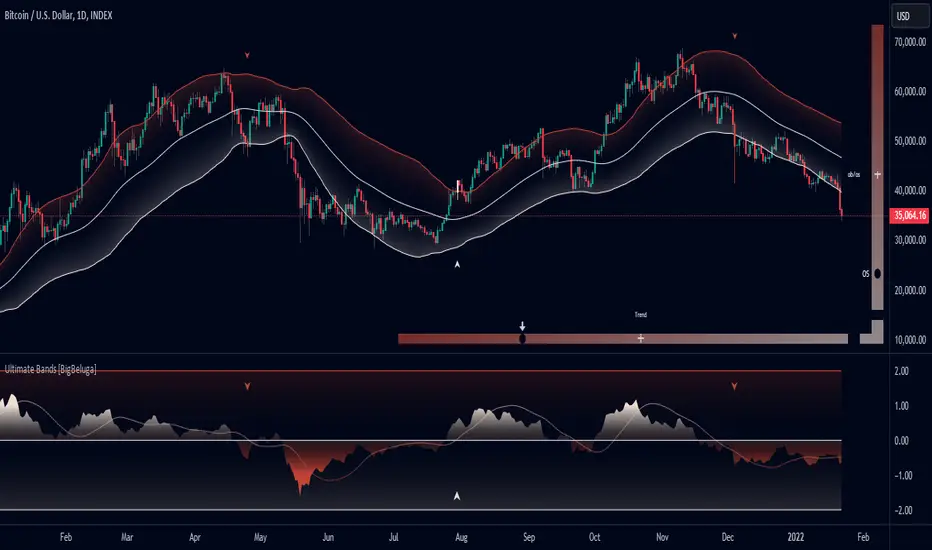
The Ultimate Bands indicator is an advanced technical analysis tool that combines elements of volatility bands, oscillators, and trend analysis. It provides traders with a comprehensive view of market conditions, including trend direction, momentum, and potential reversal points.
🔵KEY FEATURES
● Ultimate Bands
● Ultimate Oscillator
● Trend Signal Line
● Heatmap Visualization
● Breakout Signals
🔵HOW TO USE
● Trend Identification
● Entry Signals
● Exit Signals
● Overbought/Oversold Analysis
● Confirmation
🔵CUSTOMIZATION
The Ultimate Bands indicator offers several customization options:
By fine-tuning these settings, traders can adapt the Ultimate Bands indicator to various market conditions and personal trading strategies.
The Ultimate Bands indicator provides a multi-faceted approach to market analysis, combining volatility-based bands, oscillator analysis, and trend identification in one comprehensive tool. Its adaptive nature and visual cues make it suitable for both novice and experienced traders across various timeframes and markets. The integration of multiple analytical elements offers traders a rich set of data points to inform their trading decisions.
The Ultimate Bands indicator is an advanced technical analysis tool that combines elements of volatility bands, oscillators, and trend analysis. It provides traders with a comprehensive view of market conditions, including trend direction, momentum, and potential reversal points.
🔵KEY FEATURES
● Ultimate Bands
- Consists of an upper band, lower band, and a smooth middle line
- Based on John Ehler's SuperSmoother algorithm for reduced lag
- Bands are calculated using Root Mean Square Deviation (RMSD) for adaptive volatility measurement
- Helps identify potential support and resistance levels
● Ultimate Oscillator
- Derived from the price position relative to the Ultimate Bands
- Oscillates between overbought and oversold levels
- Provides insights into potential reversals and trend strength
● Trend Signal Line
- Based on a Hull Moving Average (HMA) of the Ultimate Oscillator
- Helps identify the overall trend direction
- Color-coded for easy trend interpretation
● Heatmap Visualization
- Displays the current state of the oscillator and trend signal
- Provides an intuitive visual representation of market conditions
- Shows overbought/oversold status and trend direction at a glance
● Breakout Signals
- Optional feature to detect and display breakouts beyond the Ultimate Bands
- Helps identify potential trend reversals or continuations
- Visualized with arrows on the chart and color-coded candles
🔵HOW TO USE
● Trend Identification
- Use the color and position of the Trend Signal Line to determine the overall market trend
- Refer to the heatmap for a quick visual confirmation of trend direction
● Entry Signals
- Look for price touches or breaks of the Ultimate Bands for potential entry points
- Use oscillator extremes in conjunction with band touches for stronger signals
- Consider breakout signals (if enabled) for trend-following entries
● Exit Signals
- Use opposite band touches or breakouts as potential exit points
- Monitor the oscillator for divergences or extreme readings as exit signals
● Overbought/Oversold Analysis
- Use the Ultimate Oscillator and heatmap to identify overbought/oversold conditions
- Look for potential reversals when the oscillator reaches extreme levels
● Confirmation
- Combine Ultimate Bands, Oscillator, and Trend Signal for stronger trade confirmation
- Use the heatmap for quick visual confirmation of market conditions
🔵CUSTOMIZATION
The Ultimate Bands indicator offers several customization options:
- Adjust the main calculation length for bands and oscillator
- Modify the number of standard deviations for band calculation
- Change the signal line length for trend analysis
- Toggle the display of breakout signals and candle coloring
By fine-tuning these settings, traders can adapt the Ultimate Bands indicator to various market conditions and personal trading strategies.
The Ultimate Bands indicator provides a multi-faceted approach to market analysis, combining volatility-based bands, oscillator analysis, and trend identification in one comprehensive tool. Its adaptive nature and visual cues make it suitable for both novice and experienced traders across various timeframes and markets. The integration of multiple analytical elements offers traders a rich set of data points to inform their trading decisions.
오픈 소스 스크립트
트레이딩뷰의 진정한 정신에 따라, 이 스크립트의 작성자는 이를 오픈소스로 공개하여 트레이더들이 기능을 검토하고 검증할 수 있도록 했습니다. 작성자에게 찬사를 보냅니다! 이 코드는 무료로 사용할 수 있지만, 코드를 재게시하는 경우 하우스 룰이 적용된다는 점을 기억하세요.
🔵Gain access to our powerful tools : bigbeluga.com/tv
🔵Join our free discord for updates : bigbeluga.com/discord
All scripts & content provided by BigBeluga are for informational & educational purposes only.
🔵Join our free discord for updates : bigbeluga.com/discord
All scripts & content provided by BigBeluga are for informational & educational purposes only.
면책사항
해당 정보와 게시물은 금융, 투자, 트레이딩 또는 기타 유형의 조언이나 권장 사항으로 간주되지 않으며, 트레이딩뷰에서 제공하거나 보증하는 것이 아닙니다. 자세한 내용은 이용 약관을 참조하세요.