PROTECTED SOURCE SCRIPT
업데이트됨 RVOL-Trading
Core Functionality
1. Dual RVOL Approach for Entry Confirmation
The script calculates two kinds of RVOLs for up to four intraday timeframes:
RVOL1 (based on daily average volume):
Formula: current intraday volume / 21-day SMA of daily volume
RVOL2 (based on same-timeframe average):
Formula: current intraday volume / average of past N intraday volumes (default 14)
The logic:
High RVOL1 → indicates unusual volume relative to daily historical averages.
High RVOL2 → indicates volume spike compared to typical activity at that timeframe.
2. Entry Signal – CheckGreen Condition
A bullish "Green" condition is triggered if:
Gap-up open (Opening_Price > 0)
Day’s low remains above previous close (strict lowCheck condition)
RVOL1 exceeds set thresholds (default 5% for 3m, 7% for 5m)
RVOL2 exceeds set thresholds (default 100%)
This is a strict entry filter, ensuring both price action and volume align.
💰 Position Sizing Logic
When enabled, the script calculates position size using three stop-loss methods:
Fixed SL % (e.g., 3%)
Day’s Low (LOD) below entry candle
Previous Day’s Low (PDL) below entry candle
🔢 Formula:
plaintext
Copy
Edit
Position Size = totalRisk / (entryPrice × stopLoss%)
Then it estimates position value as % of ₹1L capital (hardcoded).
Outputs include:
Number of shares
% distance to SL
Position size in lakhs (L)
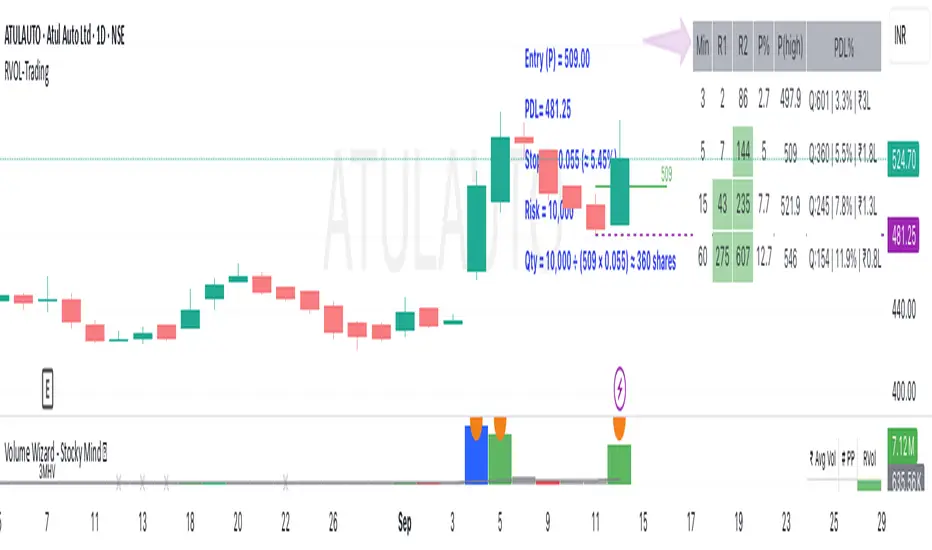
📋 RVOL Table Display
Displays in a table on the chart with the following columns:
Timeframe RVOL1 (%) RVOL2 (%) % Price Change Price SL % Position LOD-based Position PDL-based Position
Color coding helps identify which values meet thresholds.
📌 Customizable Inputs
✅ RVOL Inputs:
Days for SMA & historical volume (default: 21 & 14)
Timeframes: 3m, 5m, 15m, 60m (all configurable)
Thresholds for RVOL1, RVOL2, Gap %, and % price change
✅ Position Size Inputs:
Risk capital (default: ₹2500)
Enable/disable each SL type (SL %, LOD, PDL)
✅ Table Display:
Table size, color, location on chart
Enable/disable SL columns
🧩 Visual Elements
Draws horizontal levels for 5m/15m candle highs (if enabled)
Marks gap-up with a purple 'G' label
Color highlights on table cells for high RVOL or negative price moves
1. Dual RVOL Approach for Entry Confirmation
The script calculates two kinds of RVOLs for up to four intraday timeframes:
RVOL1 (based on daily average volume):
Formula: current intraday volume / 21-day SMA of daily volume
RVOL2 (based on same-timeframe average):
Formula: current intraday volume / average of past N intraday volumes (default 14)
The logic:
High RVOL1 → indicates unusual volume relative to daily historical averages.
High RVOL2 → indicates volume spike compared to typical activity at that timeframe.
2. Entry Signal – CheckGreen Condition
A bullish "Green" condition is triggered if:
Gap-up open (Opening_Price > 0)
Day’s low remains above previous close (strict lowCheck condition)
RVOL1 exceeds set thresholds (default 5% for 3m, 7% for 5m)
RVOL2 exceeds set thresholds (default 100%)
This is a strict entry filter, ensuring both price action and volume align.
💰 Position Sizing Logic
When enabled, the script calculates position size using three stop-loss methods:
Fixed SL % (e.g., 3%)
Day’s Low (LOD) below entry candle
Previous Day’s Low (PDL) below entry candle
🔢 Formula:
plaintext
Copy
Edit
Position Size = totalRisk / (entryPrice × stopLoss%)
Then it estimates position value as % of ₹1L capital (hardcoded).
Outputs include:
Number of shares
% distance to SL
Position size in lakhs (L)
📋 RVOL Table Display
Displays in a table on the chart with the following columns:
Timeframe RVOL1 (%) RVOL2 (%) % Price Change Price SL % Position LOD-based Position PDL-based Position
Color coding helps identify which values meet thresholds.
📌 Customizable Inputs
✅ RVOL Inputs:
Days for SMA & historical volume (default: 21 & 14)
Timeframes: 3m, 5m, 15m, 60m (all configurable)
Thresholds for RVOL1, RVOL2, Gap %, and % price change
✅ Position Size Inputs:
Risk capital (default: ₹2500)
Enable/disable each SL type (SL %, LOD, PDL)
✅ Table Display:
Table size, color, location on chart
Enable/disable SL columns
🧩 Visual Elements
Draws horizontal levels for 5m/15m candle highs (if enabled)
Marks gap-up with a purple 'G' label
Color highlights on table cells for high RVOL or negative price moves
릴리즈 노트
Enhance the formatting of the Table 보호된 스크립트입니다
이 스크립트는 비공개 소스로 게시됩니다. 하지만 이를 자유롭게 제한 없이 사용할 수 있습니다 – 자세한 내용은 여기에서 확인하세요.
면책사항
해당 정보와 게시물은 금융, 투자, 트레이딩 또는 기타 유형의 조언이나 권장 사항으로 간주되지 않으며, 트레이딩뷰에서 제공하거나 보증하는 것이 아닙니다. 자세한 내용은 이용 약관을 참조하세요.
보호된 스크립트입니다
이 스크립트는 비공개 소스로 게시됩니다. 하지만 이를 자유롭게 제한 없이 사용할 수 있습니다 – 자세한 내용은 여기에서 확인하세요.
면책사항
해당 정보와 게시물은 금융, 투자, 트레이딩 또는 기타 유형의 조언이나 권장 사항으로 간주되지 않으며, 트레이딩뷰에서 제공하거나 보증하는 것이 아닙니다. 자세한 내용은 이용 약관을 참조하세요.