OPEN-SOURCE SCRIPT
Multiple VWMA
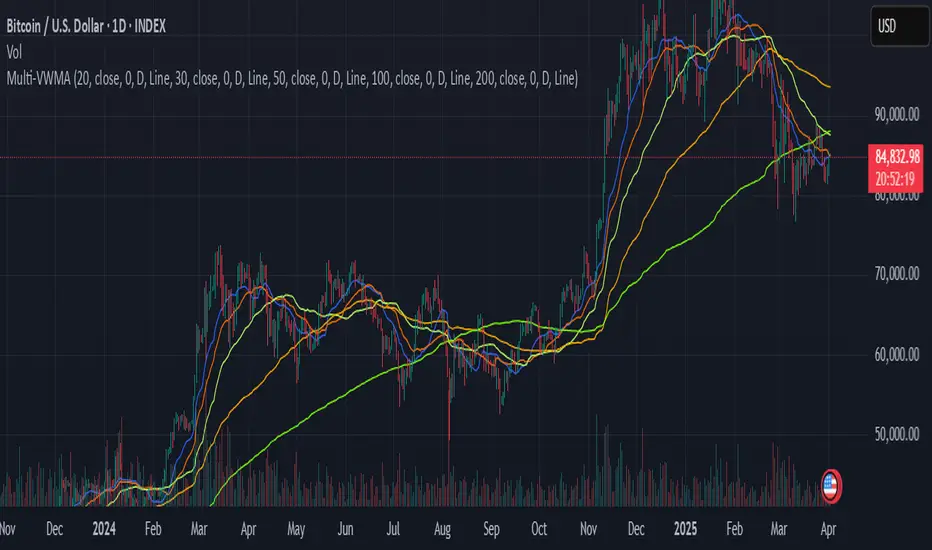
TradingView Indicator: Multiple VWMA
This TradingView indicator allows you to display up to five separate Volume Weighted Moving Averages (VWMAs) directly on your price chart.
What it does:
Plots 5 VWMAs: It calculates and draws five distinct VWMA lines (or other styles) on the chart.
Volume Weighting: Unlike simple moving averages, a VWMA gives more weight to prices where trading volume was higher, potentially offering a clearer picture of the trend strength confirmed by volume.
Highly Customizable: Each of the five VWMAs can be configured independently through the indicator's settings panel. For each one, you can set:
Length: The lookback period (number of bars) used for the calculation.
Source: The price data to use (e.g., close, open, high, low, hl2, etc.).
Timeframe: You can calculate each VWMA based on a different timeframe than the one currently displayed on your chart (e.g., view daily VWMAs on an hourly chart). Leave blank to use the chart's timeframe.
Offset: Shift the VWMA line forwards or backwards on the chart by a specific number of bars.
Style: Choose how each VWMA is displayed (Line, Histogram, or Cross).
Overlay: The VWMAs are plotted directly over the price bars for easy comparison.
Purpose:
This indicator is useful for traders who want to analyze trends using multiple volume-weighted perspectives simultaneously. By comparing VWMAs of different lengths or based on different timeframes, you can gain insights into short-term vs. long-term trends, potential support/resistance levels, and the significance of price movements based on accompanying volume.
오픈 소스 스크립트
트레이딩뷰의 진정한 정신에 따라, 이 스크립트의 작성자는 이를 오픈소스로 공개하여 트레이더들이 기능을 검토하고 검증할 수 있도록 했습니다. 작성자에게 찬사를 보냅니다! 이 코드는 무료로 사용할 수 있지만, 코드를 재게시하는 경우 하우스 룰이 적용된다는 점을 기억하세요.
면책사항
해당 정보와 게시물은 금융, 투자, 트레이딩 또는 기타 유형의 조언이나 권장 사항으로 간주되지 않으며, 트레이딩뷰에서 제공하거나 보증하는 것이 아닙니다. 자세한 내용은 이용 약관을 참조하세요.
오픈 소스 스크립트
트레이딩뷰의 진정한 정신에 따라, 이 스크립트의 작성자는 이를 오픈소스로 공개하여 트레이더들이 기능을 검토하고 검증할 수 있도록 했습니다. 작성자에게 찬사를 보냅니다! 이 코드는 무료로 사용할 수 있지만, 코드를 재게시하는 경우 하우스 룰이 적용된다는 점을 기억하세요.
면책사항
해당 정보와 게시물은 금융, 투자, 트레이딩 또는 기타 유형의 조언이나 권장 사항으로 간주되지 않으며, 트레이딩뷰에서 제공하거나 보증하는 것이 아닙니다. 자세한 내용은 이용 약관을 참조하세요.