OPEN-SOURCE SCRIPT
Donchian Reversal Signals with Labels
Overview:
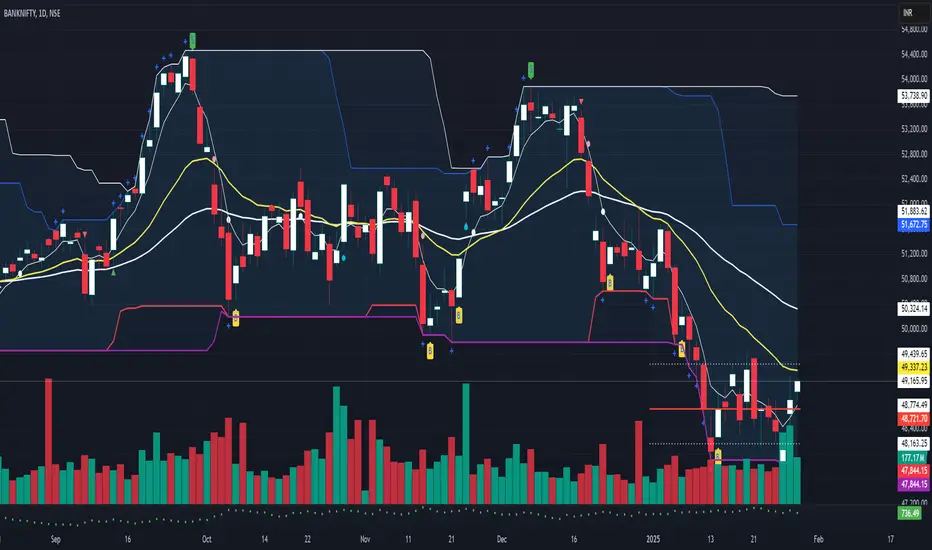
This indicator is designed to identify potential reversal signals based on price action relative to two Donchian Channels. It plots **"BUY"** and **"SELL"** labels on the chart when specific conditions are met, helping traders spot potential trend reversals.
---
Key Features:
1. Dual Donchian Channels:
- The indicator uses two Donchian Channels with user-defined lengths (`length1` and `length2`).
- The upper band of each channel is the highest high over the specified period.
- The lower band of each channel is the lowest low over the specified period.
2. Reversal Signals:
- A yellow "BUY" label appears below a green (bullish) candle if:
- The previous candle is red (bearish).
- The previous red candle touches or breaches either of the lower Donchian Channels.
- A green "SELL" label appears above a red (bearish) candle if:
- The previous candle is green (bullish).
- The previous green candle touches or breaches either of the upper Donchian Channels.
3. Visual Clarity:
- The labels are placed above or below the candles for easy visibility.
- The use of colors (yellow for buy, green for sell) makes it intuitive to interpret the signals.
---
How It Works:
1. Donchian Channel Calculation:
- The upper and lower bands of the two Donchian Channels are calculated using the highest high and lowest low over the specified periods (`length1` and `length2`).
2. Candle Color Detection:
- The script identifies whether the current and previous candles are bullish (green) or bearish (red) based on their open and close prices.
3. Signal Conditions:
- For a **"BUY" signal**:
- The current candle must be green.
- The previous candle must be red and touch or breach either of the lower Donchian Channels.
- For a **"SELL" signal**:
- The current candle must be red.
- The previous candle must be green and touch or breach either of the upper Donchian Channels.
4. Label Placement:
- The labels are plotted using `shape.labelup` and `shape.labeldown` for clear visibility.
---
Input Parameters:
- **Donchian Channel Length 1 (`length1`)**: The period for the first Donchian Channel (default: 20).
- **Donchian Channel Length 2 (`length2`)**: The period for the second Donchian Channel (default: 34).
---
How to Use:
1. Add the indicator to your chart.
2. Adjust the lengths of the Donchian Channels if needed.
3. Look for **"BUY"** and **"SELL"** labels on the chart:
- A **yellow "BUY" label** below a green candle suggests a potential bullish reversal.
- A **green "SELL" label** above a red candle suggests a potential bearish reversal.
4. Use these signals in conjunction with other technical analysis tools for confirmation.
---
Example Use Case:
- If the price touches the lower Donchian Channel and forms a red candle, followed by a green candle, a **"BUY" label** will appear, indicating a potential upward reversal.
- If the price touches the upper Donchian Channel and forms a green candle, followed by a red candle, a **"SELL" label** will appear, indicating a potential downward reversal.
---
Customization:
- You can modify the lengths of the Donchian Channels to suit your trading style.
- The colors and text of the labels can also be adjusted in the script if desired.
---
Disclaimer:
This indicator is designed to assist traders in identifying potential reversal signals. However, it should not be used in isolation. Always confirm signals with additional analysis and risk management strategies.
오픈 소스 스크립트
트레이딩뷰의 진정한 정신에 따라, 이 스크립트의 작성자는 이를 오픈소스로 공개하여 트레이더들이 기능을 검토하고 검증할 수 있도록 했습니다. 작성자에게 찬사를 보냅니다! 이 코드는 무료로 사용할 수 있지만, 코드를 재게시하는 경우 하우스 룰이 적용된다는 점을 기억하세요.
Learning smoothly & executing confidently.
면책사항
해당 정보와 게시물은 금융, 투자, 트레이딩 또는 기타 유형의 조언이나 권장 사항으로 간주되지 않으며, 트레이딩뷰에서 제공하거나 보증하는 것이 아닙니다. 자세한 내용은 이용 약관을 참조하세요.