PROTECTED SOURCE SCRIPT
MA Distance Indicator
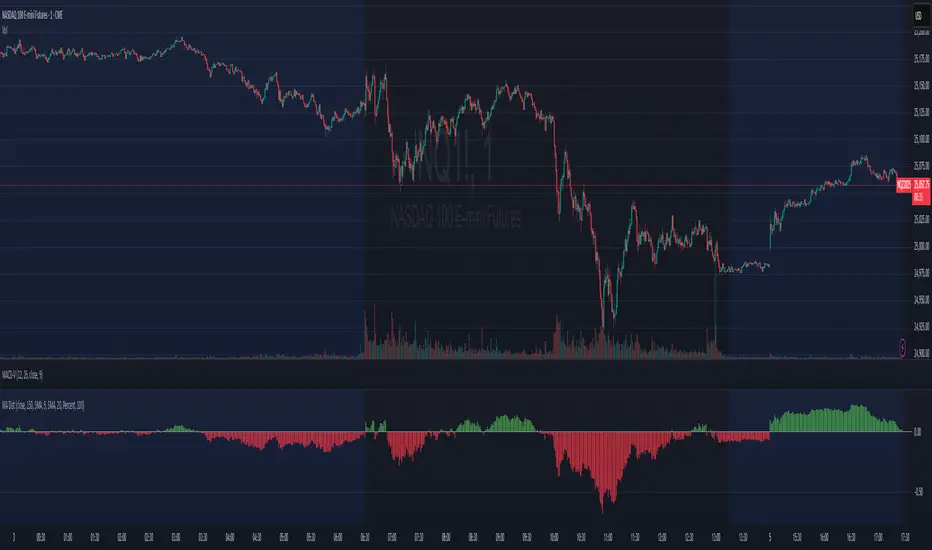
The distance from a moving average is a common way to look at how extended a stock is. This simplifies it a bit by plotting the distance below the chart, so you don't have to eyeball estimate it.
This indicator allows plotting the distance from 2 MAs, one is a histogram and one is a line.
The line MA is off by default.
The scale factor is in case you are using it intraday, it helps with small multiples of the Moving Average that would be common intraday.
"Scale by" lets you decide if the distance is measured as a percentage of the moving average level or as a count of ATRs.
보호된 스크립트입니다
이 스크립트는 비공개 소스로 게시됩니다. 하지만 이를 자유롭게 제한 없이 사용할 수 있습니다 – 자세한 내용은 여기에서 확인하세요.
면책사항
해당 정보와 게시물은 금융, 투자, 트레이딩 또는 기타 유형의 조언이나 권장 사항으로 간주되지 않으며, 트레이딩뷰에서 제공하거나 보증하는 것이 아닙니다. 자세한 내용은 이용 약관을 참조하세요.
면책사항
해당 정보와 게시물은 금융, 투자, 트레이딩 또는 기타 유형의 조언이나 권장 사항으로 간주되지 않으며, 트레이딩뷰에서 제공하거나 보증하는 것이 아닙니다. 자세한 내용은 이용 약관을 참조하세요.