OPEN-SOURCE SCRIPT
업데이트됨 Williams Vix Fix + BB & RVI (Top/Bottom) & Squeeze
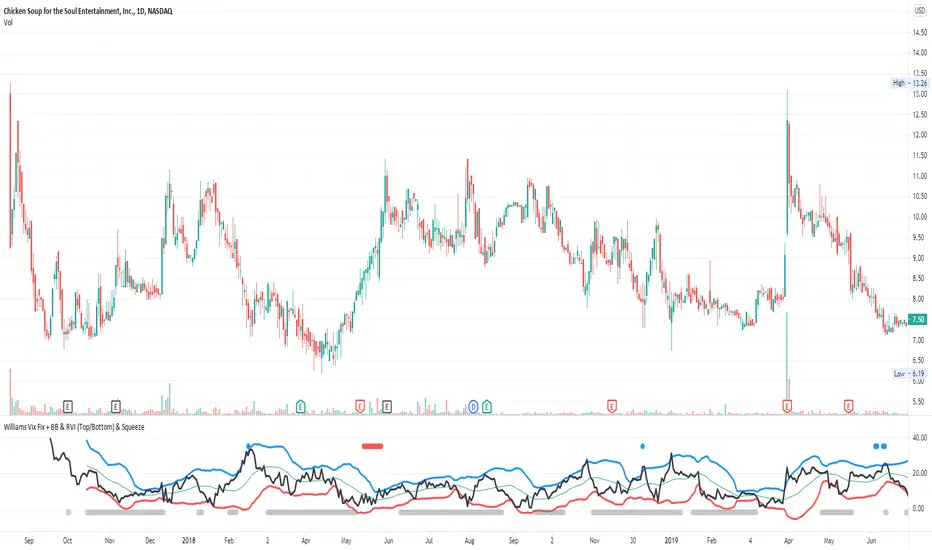
Legend :
- When line touches or crosses red band it is Top signal (Williams Vix Fix)
- When line touches or crosses blue band it is Bottom signal (Williams Vix Fix)
- Red dot at the top of indicator is a Top signal (Relative Volatility Index)
- Blue dot at the top of indicator is a Bottom signal (Relative Volatility Index)
- Gray dot at the bottom of indicator is a Squeeze signal
This is an attempt to make use of the main features of all 4 of these very popular Volatility tools :
- Williams Vix Fix + Bollinger Bands (as per Larry Williams idea, link )
- Relative Volatility Index (RVI)
- The crossing of Keltner Channel by the Bollinger Bands (Squeeze)
The goal is to find the best tool to find bottoms and top relative to volatility . This is a simple combination, but I find it very useful personally
(no need to reinvent the wheel, just need to find what works best)
The idea is that Williams Vix Fix + Bollinger Bands already give the main volatility bottom and top (Bottom are more accurate).
So instead of trying to modify it, I chose to compliment it by mapping with points when the Relative Volatility Index (RVI) reached the
top/bottom thresholds (red dot means top and blue dot means bottom). That way we can easily see when both indicators find a top or bottom relative
to volatility (of course this needs to be then confirmed with a momentum indicator rally).
In addition, I added the squeeze because this quickly shows the potential breakouts.
For ideas on how to continue this work, it would be very interesting to be able to create a probability of a bottom and top relative to volatility using the
Williams Vix Fix + Bollinger Bands and "Relative Volatility Index" signals as both work well and give top or bottom the other doesn't see.
릴리즈 노트
Added the option to plot 'Half Squeeze' in purple (bottom location), which is when a Bollinger Band crosses only 1 Keltner Channel (upper/lower)It is off by default but it can be turned on as it is also a sign of Moving Average constriction and a possible breakout.
릴리즈 노트
Updated Chart to make things clearer.릴리즈 노트
Corrected the Bollinger Band standard deviation bug from original Squeeze script.릴리즈 노트
Clean up and organize the script.릴리즈 노트
Cleaned up the code (almost fits on 1 page now)릴리즈 노트
Clean up오픈 소스 스크립트
진정한 트레이딩뷰 정신에 따라 이 스크립트 작성자는 트레이더가 기능을 검토하고 검증할 수 있도록 오픈소스로 공개했습니다. 작성자에게 찬사를 보냅니다! 무료로 사용할 수 있지만 코드를 다시 게시할 경우 하우스 룰이 적용된다는 점을 기억하세요.
면책사항
이 정보와 게시물은 TradingView에서 제공하거나 보증하는 금융, 투자, 거래 또는 기타 유형의 조언이나 권고 사항을 의미하거나 구성하지 않습니다. 자세한 내용은 이용 약관을 참고하세요.
오픈 소스 스크립트
진정한 트레이딩뷰 정신에 따라 이 스크립트 작성자는 트레이더가 기능을 검토하고 검증할 수 있도록 오픈소스로 공개했습니다. 작성자에게 찬사를 보냅니다! 무료로 사용할 수 있지만 코드를 다시 게시할 경우 하우스 룰이 적용된다는 점을 기억하세요.
면책사항
이 정보와 게시물은 TradingView에서 제공하거나 보증하는 금융, 투자, 거래 또는 기타 유형의 조언이나 권고 사항을 의미하거나 구성하지 않습니다. 자세한 내용은 이용 약관을 참고하세요.