OPEN-SOURCE SCRIPT
업데이트됨 Break/Reversal/Touch [Intromoto]

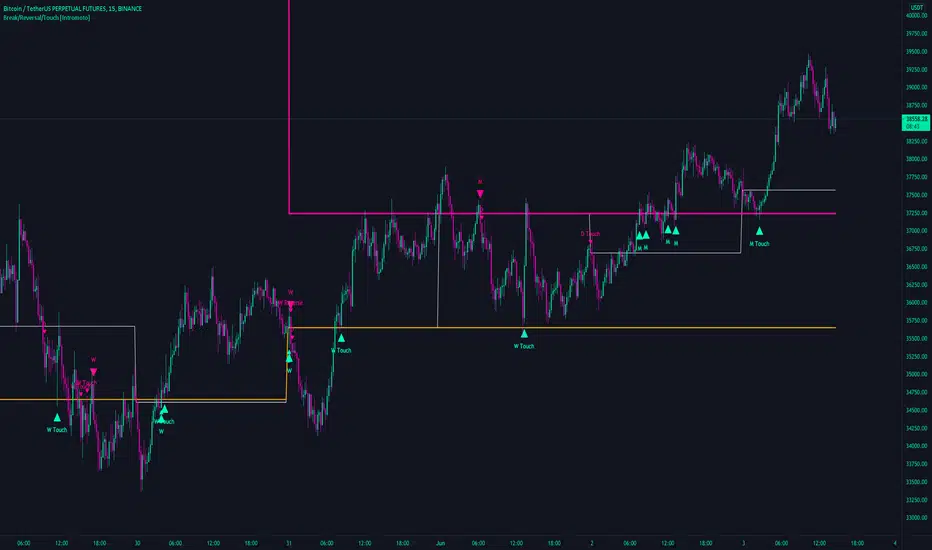
This script shows the engulfing breaks, touches and potential reversals for when prices arrives at certain time frame closes.
On publishing it shows the crossovers of the 6 hour, Daily, Weekly, and Monthly time frames.
The candle main signals are contingent on crossing over the closing level, and engulfing the previous candle. Secondary signals occur when the candle low or high touch the closing levels, in the directional color, i.e. you'll get a bearish touch signal if the candle high touches the level, and it's a red candle. Reversals occur when the subsequent candle breaks a closing level, but the current candle engulfs the previous candle in the opposing direction.
If a candles low or high hits a daily, weekly, or monthly close level it also will plot a "D/W/M Touch" in the according direction.
Thanks
릴리즈 노트
Styling and fixed repainting for plots. Visible by default릴리즈 노트
Removed 6 hour res. Style changes. Added alerts. 오픈 소스 스크립트
트레이딩뷰의 진정한 정신에 따라, 이 스크립트의 작성자는 이를 오픈소스로 공개하여 트레이더들이 기능을 검토하고 검증할 수 있도록 했습니다. 작성자에게 찬사를 보냅니다! 이 코드는 무료로 사용할 수 있지만, 코드를 재게시하는 경우 하우스 룰이 적용된다는 점을 기억하세요.
DM for access.
Follow on Twitter for updates.
One time fee, no subscription
twitter.com/IntroMoto
Follow on Twitter for updates.
One time fee, no subscription
twitter.com/IntroMoto
면책사항
해당 정보와 게시물은 금융, 투자, 트레이딩 또는 기타 유형의 조언이나 권장 사항으로 간주되지 않으며, 트레이딩뷰에서 제공하거나 보증하는 것이 아닙니다. 자세한 내용은 이용 약관을 참조하세요.
오픈 소스 스크립트
트레이딩뷰의 진정한 정신에 따라, 이 스크립트의 작성자는 이를 오픈소스로 공개하여 트레이더들이 기능을 검토하고 검증할 수 있도록 했습니다. 작성자에게 찬사를 보냅니다! 이 코드는 무료로 사용할 수 있지만, 코드를 재게시하는 경우 하우스 룰이 적용된다는 점을 기억하세요.
DM for access.
Follow on Twitter for updates.
One time fee, no subscription
twitter.com/IntroMoto
Follow on Twitter for updates.
One time fee, no subscription
twitter.com/IntroMoto
면책사항
해당 정보와 게시물은 금융, 투자, 트레이딩 또는 기타 유형의 조언이나 권장 사항으로 간주되지 않으며, 트레이딩뷰에서 제공하거나 보증하는 것이 아닙니다. 자세한 내용은 이용 약관을 참조하세요.