OPEN-SOURCE SCRIPT
업데이트됨 Lines of Chaos (ATR/ADR Levels)
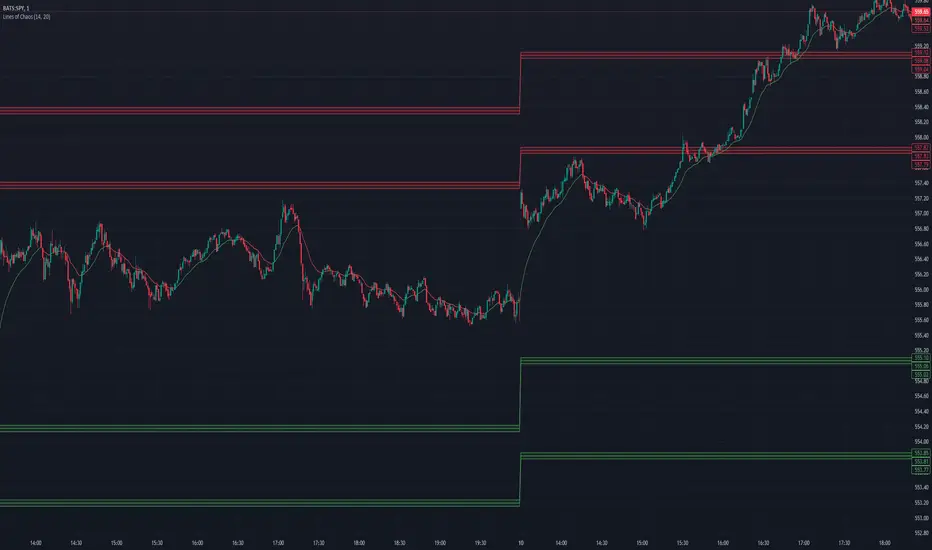
Lines of Chaos Indicator
This script is designed to provide traders with ATR (Average True Range) and ADR (Average Daily Range) support and resistance levels.
How it Works:
Key Features:
How to Use:
This script is designed to provide traders with ATR (Average True Range) and ADR (Average Daily Range) support and resistance levels.
How it Works:
- Support and Resistance Lines: The script plots ATR/ADR-based support and resistance lines based on a moving average of the last ATR/ADR Length days, the previous day's close, and the current day's open. Changing the ATR/ADR Length value changes the number of days of data to average.
- EMA: The EMA is colored red when the ticker is potentially bearish. The EMA is colored green when the ticker is potentially bullish. Changing the EMA Length changes the number of data bars to average.
- Default Settings: The default settings are optimized for most trading environments.
Key Features:
- ATR & ADR Calculation: You can use ATR, ADR, or both. ATR is recommended for most scenarios.
- Customizable Lengths: Adjust the ATR/ADR Length to refine the average calculation to your preference, with 14 being the standard value.
- EMA for Market Bias: The EMA helps determine the ticker bias. It is colored green when the market is above the average price and red when below. This allows you to more easily determine whether or not the ADR/ATR levels are valid.
- Versatile Usage: Suitable for various trading types, ensuring broad applicability across different market conditions.
How to Use:
- Bounces off Levels: When the price bounces off a support/resistance level, the price will likely respect this level. This indicates that the price is unlikely to exceed the ticker's average volatility.
- Breakthroughs of Levels: When the price breaks through a support/resistance level, the price will likely continue beyond this level. This indicates that the price has moved beyond that ticker's average volatility.
릴리즈 노트
- Added Support and Resistance Zones to make bounces/breakthroughs easier to spot when not directly on the line
- Refactored code
릴리즈 노트
- Zone Range Percentage Setting: You can now change the zone range percentage. The zone range percentage controls the size of the zones for each support/resistance level. The default of 1 (1% above, 1% below) is recommended.
- Support/Resistance Lines are now hidden by default in favor of Support/Resistance Zones
- Support/Resistance Zone Lines now have a thickness of 2 by default
오픈 소스 스크립트
트레이딩뷰의 진정한 정신에 따라, 이 스크립트의 작성자는 이를 오픈소스로 공개하여 트레이더들이 기능을 검토하고 검증할 수 있도록 했습니다. 작성자에게 찬사를 보냅니다! 이 코드는 무료로 사용할 수 있지만, 코드를 재게시하는 경우 하우스 룰이 적용된다는 점을 기억하세요.
면책사항
해당 정보와 게시물은 금융, 투자, 트레이딩 또는 기타 유형의 조언이나 권장 사항으로 간주되지 않으며, 트레이딩뷰에서 제공하거나 보증하는 것이 아닙니다. 자세한 내용은 이용 약관을 참조하세요.
오픈 소스 스크립트
트레이딩뷰의 진정한 정신에 따라, 이 스크립트의 작성자는 이를 오픈소스로 공개하여 트레이더들이 기능을 검토하고 검증할 수 있도록 했습니다. 작성자에게 찬사를 보냅니다! 이 코드는 무료로 사용할 수 있지만, 코드를 재게시하는 경우 하우스 룰이 적용된다는 점을 기억하세요.
면책사항
해당 정보와 게시물은 금융, 투자, 트레이딩 또는 기타 유형의 조언이나 권장 사항으로 간주되지 않으며, 트레이딩뷰에서 제공하거나 보증하는 것이 아닙니다. 자세한 내용은 이용 약관을 참조하세요.