OPEN-SOURCE SCRIPT
업데이트됨 Pivot Points
Pivot Points Indicator
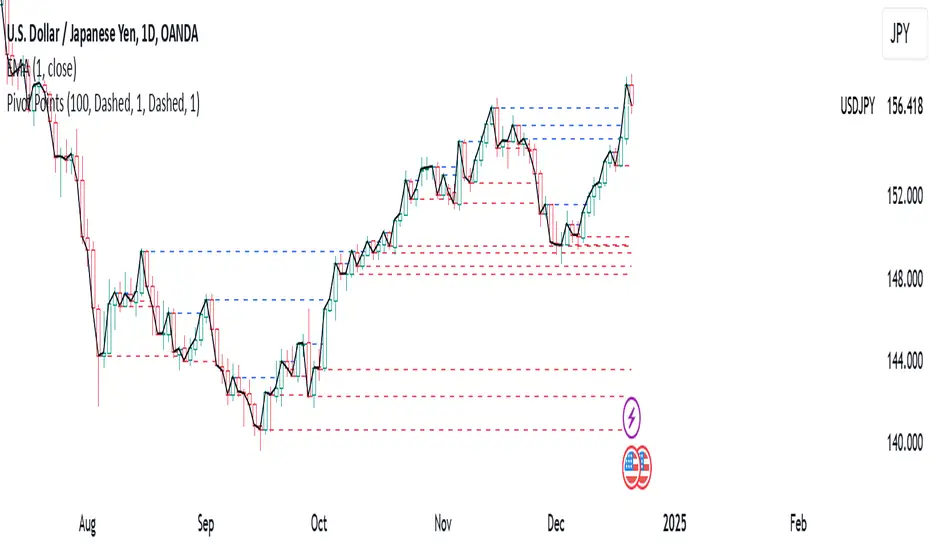
The Pivot Points indicator highlights areas on the chart where candles close in opposite colors. These points occur when the price shifts from bullish to bearish, or vice versa, indicating potential reversals or continuation patterns. These points are more easily seen on a line chart and represent areas where the price changes direction to create peak formations.
Foundational Concepts
Before diving into the indicator, it’s important to understand a few key concepts:
When price is trending upward, it creates higher highs and higher lows. Each high or low acts as a pivot point. In an uptrend, the price is more likely to break the previous high (pivot point) and continue higher. You can enter a buy trade when the price breaks the previous high, anticipating the continuation of the trend.
When price is trending downward, it creates lower lows and lower highs. Each high or low is also a pivot point. In a downtrend, the price is more likely to break the previous low (pivot point) and continue lower. You can enter a sell trade when the price breaks the previous low, anticipating the continuation of the trend.
For reversal trades, it’s helpful to be familiar with chart patterns like double tops, double bottoms, and head and shoulders. The Pivot Points indicator can assist in identifying these patterns, helping you determine entry points, as well as where to place your stop loss.
Recommended Setup
It’s recommended to have two charts open side by side: one displaying a line chart and the other showing a candlestick chart, with the Pivot Points indicator applied to both. This setup allows you to easily identify the market structure and price action as it approaches these levels. You can also add a 20-period Simple Moving Average (SMA) to both charts to help identify the overall trend. Additionally, consider adding the Relative Strength Index (RSI) to the line chart to confirm overbought or oversold conditions.
This approach can be used on any timeframe.
Contributing
If you have suggestions, improvements, or bug fixes, I encourage you to submit pull requests. Collaboration helps make the indicator more versatile and useful for everyone.
Disclaimer
Any trading decisions you make are entirely your responsibility.
The MetaTrader 5 version of this indicator is available on my GitHub repository: roshaneforde/pivot-points-indicator
릴리즈 노트
Pivot Points IndicatorThe Pivot Points indicator highlights areas on the chart where candles close in opposite colors. These points occur when the price shifts from bullish to bearish, or vice versa, indicating potential reversals or continuation patterns. These points are more easily seen on a line chart and represent areas where the price changes direction to create peak formations.
Foundational Concepts
Before diving into the indicator, it’s important to understand a few key concepts:
When price is trending upward, it creates higher highs and higher lows. Each high or low acts as a pivot point. In an uptrend, the price is more likely to break the previous high (pivot point) and continue higher. You can enter a buy trade when the price breaks the previous high, anticipating the continuation of the trend.
When price is trending downward, it creates lower lows and lower highs. Each high or low is also a pivot point. In a downtrend, the price is more likely to break the previous low (pivot point) and continue lower. You can enter a sell trade when the price breaks the previous low, anticipating the continuation of the trend.
For reversal trades, it’s helpful to be familiar with chart patterns like double tops, double bottoms, and head and shoulders. The Pivot Points indicator can assist in identifying these patterns, helping you determine entry points, as well as where to place your stop loss.
Recommended Setup
It’s recommended to have two charts open side by side: one displaying a line chart and the other showing a candlestick chart, with the Pivot Points indicator applied to both. This setup allows you to easily identify the market structure and price action as it approaches these levels. You can also add a 20-period Simple Moving Average (SMA) to both charts to help identify the overall trend. Additionally, consider adding the Relative Strength Index (RSI) to the line chart to confirm overbought or oversold conditions.
This approach can be used on any timeframe.
Contributing
If you have suggestions, improvements, or bug fixes, I encourage you to submit pull requests. Collaboration helps make the indicator more versatile and useful for everyone.
Disclaimer
Any trading decisions you make are entirely your responsibility.
The MetaTrader 5 version of this indicator is available on my GitHub repository: roshaneforde/pivot-points-indicator
릴리즈 노트
Revert to the previous version릴리즈 노트
Update the number of candles to draw on오픈 소스 스크립트
트레이딩뷰의 진정한 정신에 따라, 이 스크립트의 작성자는 이를 오픈소스로 공개하여 트레이더들이 기능을 검토하고 검증할 수 있도록 했습니다. 작성자에게 찬사를 보냅니다! 이 코드는 무료로 사용할 수 있지만, 코드를 재게시하는 경우 하우스 룰이 적용된다는 점을 기억하세요.
면책사항
해당 정보와 게시물은 금융, 투자, 트레이딩 또는 기타 유형의 조언이나 권장 사항으로 간주되지 않으며, 트레이딩뷰에서 제공하거나 보증하는 것이 아닙니다. 자세한 내용은 이용 약관을 참조하세요.
오픈 소스 스크립트
트레이딩뷰의 진정한 정신에 따라, 이 스크립트의 작성자는 이를 오픈소스로 공개하여 트레이더들이 기능을 검토하고 검증할 수 있도록 했습니다. 작성자에게 찬사를 보냅니다! 이 코드는 무료로 사용할 수 있지만, 코드를 재게시하는 경우 하우스 룰이 적용된다는 점을 기억하세요.
면책사항
해당 정보와 게시물은 금융, 투자, 트레이딩 또는 기타 유형의 조언이나 권장 사항으로 간주되지 않으며, 트레이딩뷰에서 제공하거나 보증하는 것이 아닙니다. 자세한 내용은 이용 약관을 참조하세요.