OPEN-SOURCE SCRIPT
Volume Highlight
Volume Highlight
Description:
This script helps users analyze trading volume by:
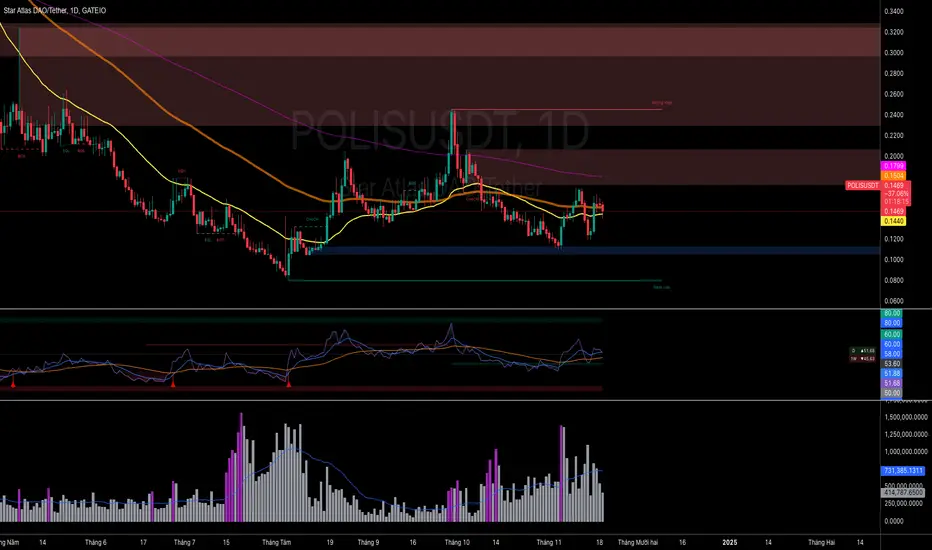
1. Highlighting the highest volume bars:
• Trading sessions with volume equal to or exceeding the highest value over the last 20 periods are displayed in purple.
• Other sessions are displayed in light gray.
2. Displaying the 20-period SMA (Simple Moving Average):
• A 20-period SMA line of the volume is included to track the general trend of trading volume.
Key Features:
• Color-coded Highlights:
• Quickly identify trading sessions with significant volume spikes.
• 20-Period SMA Line:
• Observe the overall trend of trading volume.
• Intuitive Volume Bars:
• Volume bars are clearly displayed for easy interpretation.
How to Use:
1. Add the script to your chart on TradingView.
2. Look at the color of the volume bars:
• Purple: Sessions with the highest trading volume in the past 20 periods.
• Light gray: Other sessions.
3. Use the 20-period SMA line to analyze volume trends.
Purpose:
• Analyze market momentum through trading volume.
• Support trading decisions by identifying significant volume spikes.
Illustration:
• A chart showing color-coded volume bars and the 20-period SMA line.
Description:
This script helps users analyze trading volume by:
1. Highlighting the highest volume bars:
• Trading sessions with volume equal to or exceeding the highest value over the last 20 periods are displayed in purple.
• Other sessions are displayed in light gray.
2. Displaying the 20-period SMA (Simple Moving Average):
• A 20-period SMA line of the volume is included to track the general trend of trading volume.
Key Features:
• Color-coded Highlights:
• Quickly identify trading sessions with significant volume spikes.
• 20-Period SMA Line:
• Observe the overall trend of trading volume.
• Intuitive Volume Bars:
• Volume bars are clearly displayed for easy interpretation.
How to Use:
1. Add the script to your chart on TradingView.
2. Look at the color of the volume bars:
• Purple: Sessions with the highest trading volume in the past 20 periods.
• Light gray: Other sessions.
3. Use the 20-period SMA line to analyze volume trends.
Purpose:
• Analyze market momentum through trading volume.
• Support trading decisions by identifying significant volume spikes.
Illustration:
• A chart showing color-coded volume bars and the 20-period SMA line.
오픈 소스 스크립트
트레이딩뷰의 진정한 정신에 따라, 이 스크립트의 작성자는 이를 오픈소스로 공개하여 트레이더들이 기능을 검토하고 검증할 수 있도록 했습니다. 작성자에게 찬사를 보냅니다! 이 코드는 무료로 사용할 수 있지만, 코드를 재게시하는 경우 하우스 룰이 적용된다는 점을 기억하세요.
면책사항
해당 정보와 게시물은 금융, 투자, 트레이딩 또는 기타 유형의 조언이나 권장 사항으로 간주되지 않으며, 트레이딩뷰에서 제공하거나 보증하는 것이 아닙니다. 자세한 내용은 이용 약관을 참조하세요.
오픈 소스 스크립트
트레이딩뷰의 진정한 정신에 따라, 이 스크립트의 작성자는 이를 오픈소스로 공개하여 트레이더들이 기능을 검토하고 검증할 수 있도록 했습니다. 작성자에게 찬사를 보냅니다! 이 코드는 무료로 사용할 수 있지만, 코드를 재게시하는 경우 하우스 룰이 적용된다는 점을 기억하세요.
면책사항
해당 정보와 게시물은 금융, 투자, 트레이딩 또는 기타 유형의 조언이나 권장 사항으로 간주되지 않으며, 트레이딩뷰에서 제공하거나 보증하는 것이 아닙니다. 자세한 내용은 이용 약관을 참조하세요.