OPEN-SOURCE SCRIPT
업데이트됨 Buying Opportunity Score V2.1
Overview
A composite scoring system (0-100) that identifies high-probability buying opportunities during market pullbacks. Validated through backtesting on SPY from 2010-2024.
How It Works
The indicator combines multiple fear and oversold signals into a single actionable score. When fear is elevated and the market is oversold, the score rises. Higher scores historically correlate with better forward returns.
Scoring Components
VIX Level (30 pts) - Market fear gauge
Drawdown (30 pts) - Distance from 52-week high
RSI 14 (12 pts) - Oversold confirmation
Bollinger Band (13 pts) - Statistical extreme
VIX Timing (15 pts) - Bonus when VIX declining from peak
Signal Levels
80+ = STRONG BUY (high conviction)
70-79 = BUY (consider entry)
60-69 = WATCH (monitor closely)
Below 60 = No signal
Backtest Results (SPY, 2010-2024)
70+ Signals: 85% win rate, 7.5% average 20-day return
80+ Signals: 100% win rate, 14% average 20-day return
Features
Statistics table showing 1Y, 3Y, 5Y rolling performance
Signal markers (green triangles) on buy signals
Outcome labels showing WIN/LOSS after measurement period
Multiple alert options
Works on SPY, QQQ, IWM (use VIX for all)
How To Use
Add to SPY, QQQ, or IWM (daily timeframe)
Wait for score to reach 70+ or 80+
Green triangle marks signal day
Check statistics table for recent performance
Set alerts for notifications
Alerts Available
STRONG BUY Signal (80+)
BUY Signal (70+)
Moderate Signal (60+)
Score Crossed 80/70
Score Dropped Below 70
Important Notes
Designed for daily timeframe on broad market ETFs
Signals confirm at end of day (bar close)
Statistics table shows rolling windows based on loaded data
Past performance does not guarantee future results
릴리즈 노트
Overview:A composite scoring system (0-100) that identifies high-probability buying opportunities during market pullbacks. Validated through backtesting on SPY from 2010-2024.
How It Works
The indicator combines multiple fear and oversold signals into a single actionable score. When fear is elevated and the market is oversold, the score rises. Higher scores historically correlate with better forward returns.
Scoring Components
VIX Level (30 pts) - Market fear gauge
Drawdown (30 pts) - Distance from 52-week high
RSI 14 (12 pts) - Oversold confirmation
Bollinger Band (13 pts) - Statistical extreme
VIX Timing (15 pts) - Bonus when VIX declining from peak
Signal Levels
80+ = STRONG BUY (high conviction)
70-79 = BUY (consider entry)
60-69 = WATCH (monitor closely)
Below 60 = No signal
Backtest Results (SPY, 2010-2024)
70+ Signals: 85% win rate, 7.5% average 20-day return
80+ Signals: 100% win rate, 14% average 20-day return
Features
Statistics table showing 1Y, 3Y, 5Y rolling performance
Signal markers (green triangles) on buy signals
Outcome labels showing WIN/LOSS after measurement period
Multiple alert options
Works on SPY, QQQ, IWM (use VIX for all)
How To Use
Add to SPY, QQQ, or IWM (daily timeframe)
Wait for score to reach 70+ or 80+
Green triangle marks signal day
Check statistics table for recent performance
Set alerts for notifications
Alerts Available
STRONG BUY Signal (80+)
BUY Signal (70+)
Moderate Signal (60+)
Score Crossed 80/70
Score Dropped Below 70
Important Notes
Designed for daily timeframe on broad market ETFs
Signals confirm at end of day (bar close)
Statistics table shows rolling windows based on loaded data
Past performance does not guarantee future results
릴리즈 노트
OverviewA composite scoring system (0-100) that identifies high-probability buying opportunities during market pullbacks. Validated through backtesting on SPY from 2010-2024.
How It Works
The indicator combines multiple fear and oversold signals into a single actionable score. When fear is elevated and the market is oversold, the score rises. Higher scores historically correlate with better forward returns.
Scoring Components
VIX Level (30 pts) - Market fear gauge
Drawdown (30 pts) - Distance from 52-week high
RSI 14 (12 pts) - Oversold confirmation
Bollinger Band (13 pts) - Statistical extreme
VIX Timing (15 pts) - Bonus when VIX declining from peak
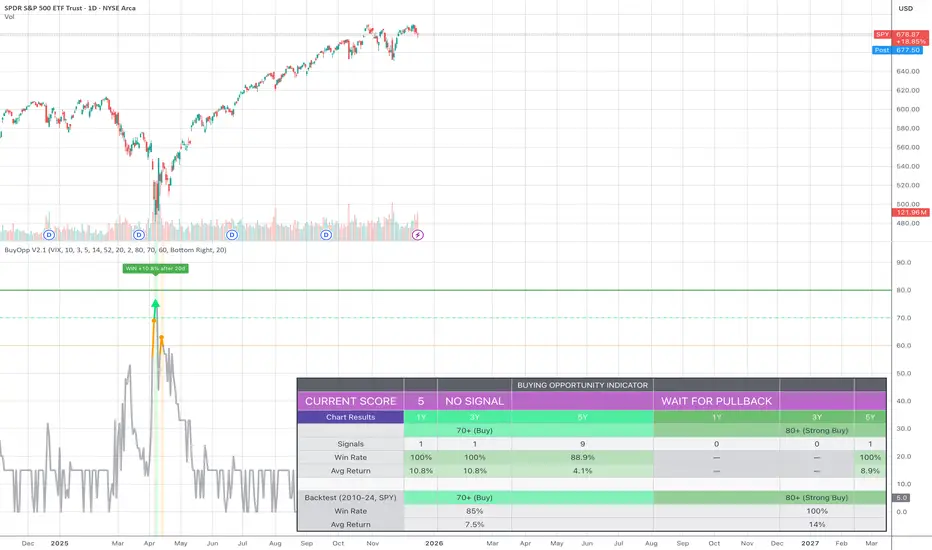
Current Score
The table displays your live score (0-100) with context:
0-29 = WAIT FOR PULLBACK - Market calm, no opportunity
30-49 = NOT ACTIONABLE - Mild stress
50-59 = MONITOR - Fear rising
60-69 = WATCH - Potential entry soon
70-79 = BUY - Consider entering
80+ = STRONG BUY - High conviction entry
Signal Levels
80+ = STRONG BUY (high conviction)
70-79 = BUY (consider entry)
60-69 = WATCH (monitor closely)
Below 60 = No signal
Backtest Results (SPY, 2010-2024)
70+ Signals: 85% win rate, 7.5% average 20-day return
80+ Signals: 100% win rate, 14% average 20-day return
Features
Statistics table showing 1Y, 3Y, 5Y rolling performance
Signal markers (green triangles) on buy signals
Outcome labels showing WIN/LOSS result after 20 days
Multiple alert options
Works on SPY, QQQ, IWM (use VIX for all)
How To Use
Add to SPY, QQQ, or IWM (daily timeframe)
Check the CURRENT SCORE row for today's reading
Wait for score to reach 70+ or 80+
Green triangle marks signal day
Set alerts for notifications
Alerts Available
STRONG BUY Signal (80+)
BUY Signal (70+)
Moderate Signal (60+)
Score Crossed 80/70
Score Dropped Below 70
Important Notes
Designed for daily timeframe on broad market ETFs
Signals confirm at end of day (bar close)
Chart Results show rolling 1Y/3Y/5Y performance from loaded data
Backtest row shows validated 2010-2024 SPY results
Past performance does not guarantee future results
오픈 소스 스크립트
트레이딩뷰의 진정한 정신에 따라, 이 스크립트의 작성자는 이를 오픈소스로 공개하여 트레이더들이 기능을 검토하고 검증할 수 있도록 했습니다. 작성자에게 찬사를 보냅니다! 이 코드는 무료로 사용할 수 있지만, 코드를 재게시하는 경우 하우스 룰이 적용된다는 점을 기억하세요.
면책사항
해당 정보와 게시물은 금융, 투자, 트레이딩 또는 기타 유형의 조언이나 권장 사항으로 간주되지 않으며, 트레이딩뷰에서 제공하거나 보증하는 것이 아닙니다. 자세한 내용은 이용 약관을 참조하세요.
오픈 소스 스크립트
트레이딩뷰의 진정한 정신에 따라, 이 스크립트의 작성자는 이를 오픈소스로 공개하여 트레이더들이 기능을 검토하고 검증할 수 있도록 했습니다. 작성자에게 찬사를 보냅니다! 이 코드는 무료로 사용할 수 있지만, 코드를 재게시하는 경우 하우스 룰이 적용된다는 점을 기억하세요.
면책사항
해당 정보와 게시물은 금융, 투자, 트레이딩 또는 기타 유형의 조언이나 권장 사항으로 간주되지 않으며, 트레이딩뷰에서 제공하거나 보증하는 것이 아닙니다. 자세한 내용은 이용 약관을 참조하세요.