PROTECTED SOURCE SCRIPT
업데이트됨 soRSIs - Stochastic RSI versus RSI Group
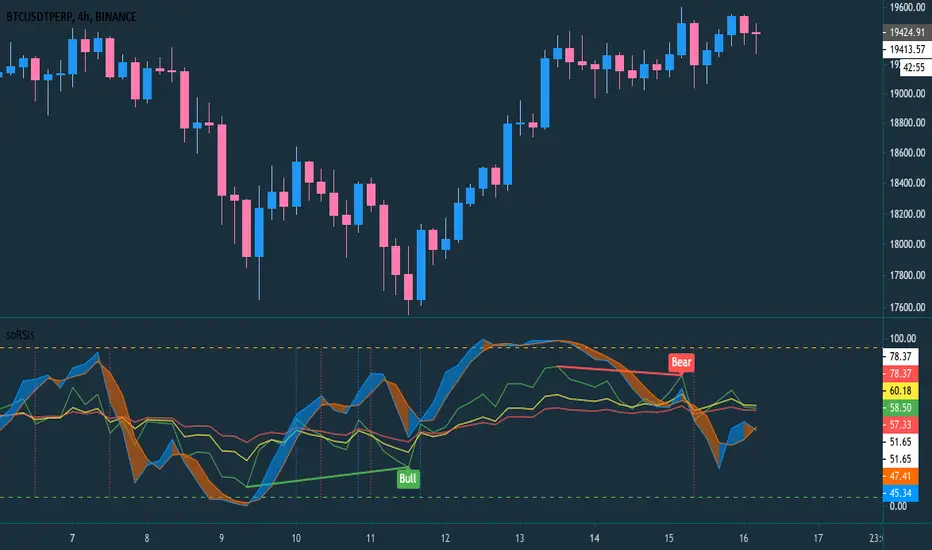
soRSIs is about collaboration between Stochastic Relative Strength Index (SRSI) with Relative Strength Index (RSI) Group
RSI Group is group from three RSI, by default is 6,14, and 25
How to read:
It works in all time frames, but please keep in mind, higher timeframe can have stronger confirmation and trend.
The indicator settings:
*Show Crossed RSI: default is true, it will show vertical line if RSI1 crossed under/over the RSI2 and RSI3
*Source: default value is close, it is the resource when and where data are taken
*RSI1: default value is 6, but user can change any value
*RSI2: default value is 14, but user can change any value
*RSI1: default value is 25, but user can change any value
*Overbought: default value is 95, it is horizontal line on the top that indicates over bought or strength index fullness
*Overbought: default value is 5, it is horizontal line on the top that indicates over sold or strength index weakness
*The rest settings are about Stochastic RSI
RSI Group is group from three RSI, by default is 6,14, and 25
How to read:
- If SRSI crossed over RSI Group, it can indicate an uptrend confirmation
- If SRSI crossed under RSI Group, it can indicate a downtrend confirmation
- If SRSI rejected to cross under RSI Group, it can indicate a correction recovery
- If SRSI rejected to cross over RSI Group, it can indicate continuity correction
- If RSI group perform descending 25,14,6, it can indicate bearish
- If RSI group perform ascending 6,14,25, it can indicate bullish
- If RSI group or SRSI reaches overbought line, it can indicate warning for LONG and good for SHORT
- If RSI group or SRSI reaches oversold line, it can indicate warning for SHORT and good for LONG
It works in all time frames, but please keep in mind, higher timeframe can have stronger confirmation and trend.
The indicator settings:
*Show Crossed RSI: default is true, it will show vertical line if RSI1 crossed under/over the RSI2 and RSI3
*Source: default value is close, it is the resource when and where data are taken
*RSI1: default value is 6, but user can change any value
*RSI2: default value is 14, but user can change any value
*RSI1: default value is 25, but user can change any value
*Overbought: default value is 95, it is horizontal line on the top that indicates over bought or strength index fullness
*Overbought: default value is 5, it is horizontal line on the top that indicates over sold or strength index weakness
*The rest settings are about Stochastic RSI
릴리즈 노트
Added divergence보호된 스크립트입니다
이 스크립트는 비공개 소스로 게시됩니다. 하지만 이를 자유롭게 제한 없이 사용할 수 있습니다 – 자세한 내용은 여기에서 확인하세요.
면책사항
해당 정보와 게시물은 금융, 투자, 트레이딩 또는 기타 유형의 조언이나 권장 사항으로 간주되지 않으며, 트레이딩뷰에서 제공하거나 보증하는 것이 아닙니다. 자세한 내용은 이용 약관을 참조하세요.
보호된 스크립트입니다
이 스크립트는 비공개 소스로 게시됩니다. 하지만 이를 자유롭게 제한 없이 사용할 수 있습니다 – 자세한 내용은 여기에서 확인하세요.
면책사항
해당 정보와 게시물은 금융, 투자, 트레이딩 또는 기타 유형의 조언이나 권장 사항으로 간주되지 않으며, 트레이딩뷰에서 제공하거나 보증하는 것이 아닙니다. 자세한 내용은 이용 약관을 참조하세요.