PROTECTED SOURCE SCRIPT
Abundance
This script has been built keeping Indian markets in mind.
This script is for all those LONG TERM investors who want to invest in Stocks and ETFs. It is meticulously designed to assist investors in building robust portfolios, combine the power of Super Trend, RSI (Relative Strength Index), Exponential Moving Averages (EMAs), and their relative positions (eg if 50 EMA is above 200 EMA it signals uptrend). By delivering precise alerts and buy signals on a daily timeframe, it empower users to make informed investment decisions and confidently navigate the complexities of financial markets. The strategies combine structure with flexibility, accommodating both cautious and high-risk investment styles to align with varied investor goals. Each component of the strategy adds a distinct viewpoint and approach to asset growth, creating a well-rounded framework for investors aiming to enhance portfolio performance. By diligently applying this multi-faceted approach, investors can make informed decisions and effectively capitalize on potential market opportunities.
Indicator is meant for Daily timeframe and it will only generate buying signals using arrows on this time frame, and no other
Indicator is an all in one indicator, keeping both ETFs and stocks in mind and generates signals in both asset class using different accumulation strategy.
Note - 50 EMA on Daily time frame - has been used to determine medium term trend
200 EMA on Daily time frame - has been used to determine Long term trend
Daily TF - short-term
Weekly TF - medium term
Monthly TF - long term
For ETFs
ETFs Selection Criteria: The system employs specific criteria for selecting ETFs:
We are giving investors further granularity by giving them 4 different levels of accumulation.
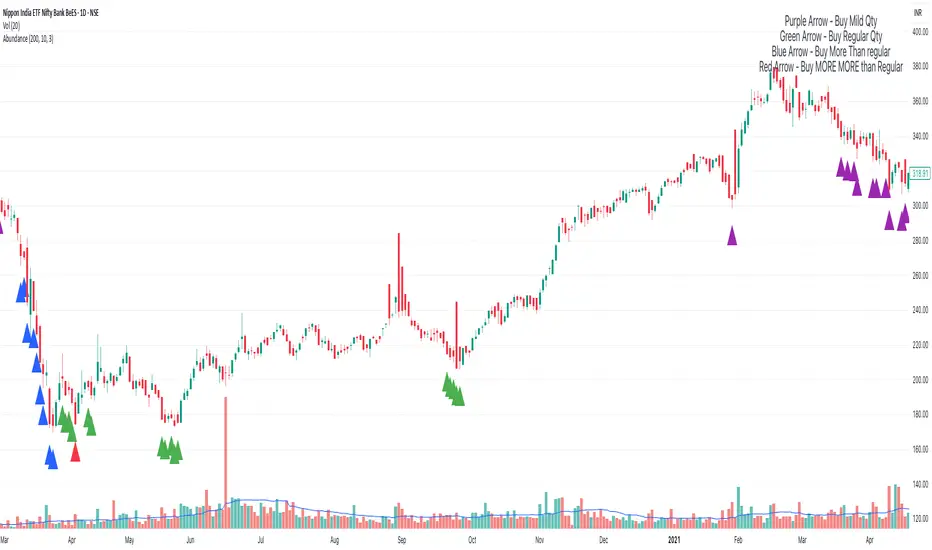
Purple Arrow signifies mild level to accumulate - this is for aggressive investors who want to use the buying on dip strategy to accumulate. Here we use relative positions of 50 and 200 EMA to make sure the script is in a Uptrend in daily timeframe and every time RSI goes in oversold zone i.e. below 40 and ETF Close price is between 50 and 200 EMA we generate an accumulation signal. Here we also check RSI on weekly timeframe and make sure it's value is above 50 and if not the accumulation signal won't be generated because that could mean the medium term trend(weekly timeframe) is getting weaker
Green Arrow signifies a medium level to accumulate - this suggests that the script is in downtrend in daily timeframe i.e. 200 EMA > 50 EMA and whenever the RSI on daily timeframe goes in oversold zone and the close price is below 200 MA.
Blue Arrow signifies a strong level to accumulate - here, we also bring in RSI level on weekly time frame and we generate blue arrow when RSI on both daily and weekly are in oversold zone and the price is below 200 EMA on daily. This is for conservative and patient investors to accumulate the script during medium term correction phase.
Red Arrow signifies very strong level to accumulate - here, we also bring in RSI level on Monthly time frame along with weekly and we generate of red arrow when RSI on all daily, weekly and Monthly are in oversold zone and the price is below 200 EMA on daily. This is a very rare occurrence and are great opportunity to accumulate during long term correction phase. Investors need to know that red arrow signifies script is very weak on all time frames, and it could take good amount of time to generate returns.
Above key is also mentioned on the Top right of the chart to keep the investors informed what the different colored arrows means.

Additionally, it's recommended to track index ETFs, in line with the system's approach. This strategy simplifies the process of identifying investment opportunities within this asset class, particularly during periods of market weakness.
For Stocks
It is recommended to apply this strategy in nifty 200 stocks (proven Stocks with track record)
We are giving investors, two levels of accumulation
Level 1 - Purple arrow - mild Accumulation
The Accumulation signal is designed for those who have either already accumulated in Potential Reversal zone given by this indicator or have completely missed those chances and are determined not to miss significant opportunities within a continuous uptrend and seek a way to enter a trend. While it offers a more aggressive entry approach, it is ideal for individuals willing to take calculated risks to potentially reap substantial long-term rewards. This strategy is particularly suitable for accumulating stocks for aggressive long-term investment.
Here's a detailed description of the strategy:
Objective: The primary aim of the strategy is to provide an avenue for investors to identify short-term trend reversals and seize the opportunity to enter stocks during an uptrend, thereby capitalizing on a sustained bull run.
Stock Selection Criteria: The strategy utilizes a specific set of criteria for stock selection:
Stocks weekly and monthly RSI is above 50 (indicating medium and long term trend are not weak i.e. below 40)
1. 50EMA and 200 EMA(Exponential Moving Average): It targets stocks that are trading below the 50-day EMA and above 200 EMA while making sure 50 EMA is above 200 EMA(signifies uptrend). This signals a short-term reversal from the top and indicates that the stock is in a downtrend.
2. ADX (Average Directional Index) measures the strength of a trend, not its direction (We are using EMAs to determine direction) and if ADX is less than 22 then we are generating an accumulation signal(value above 22 would mean trend is getting stronger and using EMAs we know it is a downtrend so we don't want ADX to be above 22 which would mean that the short term downfall we thought was an opportunity to accumulate is becoming a stronger downtrend)

Level 2 - For signifies strong accumulation/ Potential Reversal zone
This Accumulation signal is meticulously designed to identify pivotal stock price movements, allowing investors to make informed choices and capitalize on upward market trends while minimizing risk. Here's a comprehensive overview of the system, emphasizing its suitability for conservative investors:
Objective: The primary objective of the system is to accumulate stocks as long-term investments in your portfolio while prioritizing capital preservation. It offers a disciplined approach to pinpointing potential entry points for stocks, particularly during market corrections and trend reversals, thereby enabling you to actively participate in bullish market phases while adopting a conservative risk management stance.
Stock Selection Criteria: The system employs a stringent set of criteria to select stocks for investment:
• Correction Mode: It identifies stocks that have undergone a correction, signifying a decline in stock prices from their recent highs. This conservative approach emphasizes the importance of seeking stocks with a history of stability(that's why Nifty 200 stocks are recommended).
• 200EMA (Exponential Moving Average): The system diligently analyses daily stock price movements, specifically looking for stocks that have fallen to or below the 200-day Exponential Moving Average. This indicator suggests potential overselling and aligns with a conservative strategy of buying low.
Trend Reversal Confirmation: The system doesn't merely pinpoint stocks in correction mode; it takes an extra step to confirm a trend reversal. It employs the following indicators:
• Short-term Downtrends Reversal: This aspect focuses on identifying the reversal of short-term downtrends in stock prices, observed through the transition of the super trend indicator from the red zone to the green zone. This cautious approach ensures that the trend is genuinely shifting.
• Super Trend Zones: These zones are crucial for assessing whether a stock is in a bullish or bearish trend. The system consistently monitors these zones to confirm a potential trend reversal.
Alert & Buy Signals: When the system identifies stocks that have reached a potential bottom and are on the verge of a trend reversal, it issues vital alert signals, aiding conservative investors in prudent decision-making:
• Orange Upside Triangle Sign: This signal serves as a cautious heads-up, indicating that a stock may be poised for a trend reversal. It advises investors to prepare funds for potential investment without taking undue risks.
• Green Upside Triangle Sign: This is the confirmation of a trend reversal, signifying a robust buy signal. Conservative investors can confidently enter the market at this point, accumulating stocks for a long-term investment, secure in the knowledge that the trend is in their favour.
• Additionally, if the Supertrend transitions from green to red zone during the alert signal is active and before the buy signal, the setup will be considered invalid. This adjustment ensures precise trend reversal identification during corrections. The conservative investors to confidently enter the market, accumulating discounted stocks primarily at the bottom while avoiding unnecessary signals.

This script is for all those LONG TERM investors who want to invest in Stocks and ETFs. It is meticulously designed to assist investors in building robust portfolios, combine the power of Super Trend, RSI (Relative Strength Index), Exponential Moving Averages (EMAs), and their relative positions (eg if 50 EMA is above 200 EMA it signals uptrend). By delivering precise alerts and buy signals on a daily timeframe, it empower users to make informed investment decisions and confidently navigate the complexities of financial markets. The strategies combine structure with flexibility, accommodating both cautious and high-risk investment styles to align with varied investor goals. Each component of the strategy adds a distinct viewpoint and approach to asset growth, creating a well-rounded framework for investors aiming to enhance portfolio performance. By diligently applying this multi-faceted approach, investors can make informed decisions and effectively capitalize on potential market opportunities.
Indicator is meant for Daily timeframe and it will only generate buying signals using arrows on this time frame, and no other
Indicator is an all in one indicator, keeping both ETFs and stocks in mind and generates signals in both asset class using different accumulation strategy.
Note - 50 EMA on Daily time frame - has been used to determine medium term trend
200 EMA on Daily time frame - has been used to determine Long term trend
Daily TF - short-term
Weekly TF - medium term
Monthly TF - long term
For ETFs
ETFs Selection Criteria: The system employs specific criteria for selecting ETFs:
We are giving investors further granularity by giving them 4 different levels of accumulation.
Purple Arrow signifies mild level to accumulate - this is for aggressive investors who want to use the buying on dip strategy to accumulate. Here we use relative positions of 50 and 200 EMA to make sure the script is in a Uptrend in daily timeframe and every time RSI goes in oversold zone i.e. below 40 and ETF Close price is between 50 and 200 EMA we generate an accumulation signal. Here we also check RSI on weekly timeframe and make sure it's value is above 50 and if not the accumulation signal won't be generated because that could mean the medium term trend(weekly timeframe) is getting weaker
Green Arrow signifies a medium level to accumulate - this suggests that the script is in downtrend in daily timeframe i.e. 200 EMA > 50 EMA and whenever the RSI on daily timeframe goes in oversold zone and the close price is below 200 MA.
Blue Arrow signifies a strong level to accumulate - here, we also bring in RSI level on weekly time frame and we generate blue arrow when RSI on both daily and weekly are in oversold zone and the price is below 200 EMA on daily. This is for conservative and patient investors to accumulate the script during medium term correction phase.
Red Arrow signifies very strong level to accumulate - here, we also bring in RSI level on Monthly time frame along with weekly and we generate of red arrow when RSI on all daily, weekly and Monthly are in oversold zone and the price is below 200 EMA on daily. This is a very rare occurrence and are great opportunity to accumulate during long term correction phase. Investors need to know that red arrow signifies script is very weak on all time frames, and it could take good amount of time to generate returns.
Above key is also mentioned on the Top right of the chart to keep the investors informed what the different colored arrows means.
Additionally, it's recommended to track index ETFs, in line with the system's approach. This strategy simplifies the process of identifying investment opportunities within this asset class, particularly during periods of market weakness.
For Stocks
It is recommended to apply this strategy in nifty 200 stocks (proven Stocks with track record)
We are giving investors, two levels of accumulation
Level 1 - Purple arrow - mild Accumulation
The Accumulation signal is designed for those who have either already accumulated in Potential Reversal zone given by this indicator or have completely missed those chances and are determined not to miss significant opportunities within a continuous uptrend and seek a way to enter a trend. While it offers a more aggressive entry approach, it is ideal for individuals willing to take calculated risks to potentially reap substantial long-term rewards. This strategy is particularly suitable for accumulating stocks for aggressive long-term investment.
Here's a detailed description of the strategy:
Objective: The primary aim of the strategy is to provide an avenue for investors to identify short-term trend reversals and seize the opportunity to enter stocks during an uptrend, thereby capitalizing on a sustained bull run.
Stock Selection Criteria: The strategy utilizes a specific set of criteria for stock selection:
Stocks weekly and monthly RSI is above 50 (indicating medium and long term trend are not weak i.e. below 40)
1. 50EMA and 200 EMA(Exponential Moving Average): It targets stocks that are trading below the 50-day EMA and above 200 EMA while making sure 50 EMA is above 200 EMA(signifies uptrend). This signals a short-term reversal from the top and indicates that the stock is in a downtrend.
2. ADX (Average Directional Index) measures the strength of a trend, not its direction (We are using EMAs to determine direction) and if ADX is less than 22 then we are generating an accumulation signal(value above 22 would mean trend is getting stronger and using EMAs we know it is a downtrend so we don't want ADX to be above 22 which would mean that the short term downfall we thought was an opportunity to accumulate is becoming a stronger downtrend)
Level 2 - For signifies strong accumulation/ Potential Reversal zone
This Accumulation signal is meticulously designed to identify pivotal stock price movements, allowing investors to make informed choices and capitalize on upward market trends while minimizing risk. Here's a comprehensive overview of the system, emphasizing its suitability for conservative investors:
Objective: The primary objective of the system is to accumulate stocks as long-term investments in your portfolio while prioritizing capital preservation. It offers a disciplined approach to pinpointing potential entry points for stocks, particularly during market corrections and trend reversals, thereby enabling you to actively participate in bullish market phases while adopting a conservative risk management stance.
Stock Selection Criteria: The system employs a stringent set of criteria to select stocks for investment:
• Correction Mode: It identifies stocks that have undergone a correction, signifying a decline in stock prices from their recent highs. This conservative approach emphasizes the importance of seeking stocks with a history of stability(that's why Nifty 200 stocks are recommended).
• 200EMA (Exponential Moving Average): The system diligently analyses daily stock price movements, specifically looking for stocks that have fallen to or below the 200-day Exponential Moving Average. This indicator suggests potential overselling and aligns with a conservative strategy of buying low.
Trend Reversal Confirmation: The system doesn't merely pinpoint stocks in correction mode; it takes an extra step to confirm a trend reversal. It employs the following indicators:
• Short-term Downtrends Reversal: This aspect focuses on identifying the reversal of short-term downtrends in stock prices, observed through the transition of the super trend indicator from the red zone to the green zone. This cautious approach ensures that the trend is genuinely shifting.
• Super Trend Zones: These zones are crucial for assessing whether a stock is in a bullish or bearish trend. The system consistently monitors these zones to confirm a potential trend reversal.
Alert & Buy Signals: When the system identifies stocks that have reached a potential bottom and are on the verge of a trend reversal, it issues vital alert signals, aiding conservative investors in prudent decision-making:
• Orange Upside Triangle Sign: This signal serves as a cautious heads-up, indicating that a stock may be poised for a trend reversal. It advises investors to prepare funds for potential investment without taking undue risks.
• Green Upside Triangle Sign: This is the confirmation of a trend reversal, signifying a robust buy signal. Conservative investors can confidently enter the market at this point, accumulating stocks for a long-term investment, secure in the knowledge that the trend is in their favour.
• Additionally, if the Supertrend transitions from green to red zone during the alert signal is active and before the buy signal, the setup will be considered invalid. This adjustment ensures precise trend reversal identification during corrections. The conservative investors to confidently enter the market, accumulating discounted stocks primarily at the bottom while avoiding unnecessary signals.
보호된 스크립트입니다
이 스크립트는 비공개 소스로 게시됩니다. 하지만 제한 없이 자유롭게 사용할 수 있습니다 — 여기에서 자세히 알아보기.
면책사항
이 정보와 게시물은 TradingView에서 제공하거나 보증하는 금융, 투자, 거래 또는 기타 유형의 조언이나 권고 사항을 의미하거나 구성하지 않습니다. 자세한 내용은 이용 약관을 참고하세요.
보호된 스크립트입니다
이 스크립트는 비공개 소스로 게시됩니다. 하지만 제한 없이 자유롭게 사용할 수 있습니다 — 여기에서 자세히 알아보기.
면책사항
이 정보와 게시물은 TradingView에서 제공하거나 보증하는 금융, 투자, 거래 또는 기타 유형의 조언이나 권고 사항을 의미하거나 구성하지 않습니다. 자세한 내용은 이용 약관을 참고하세요.