INVITE-ONLY SCRIPT
업데이트됨 [Beta] Volume Delta in Candle v.1.0
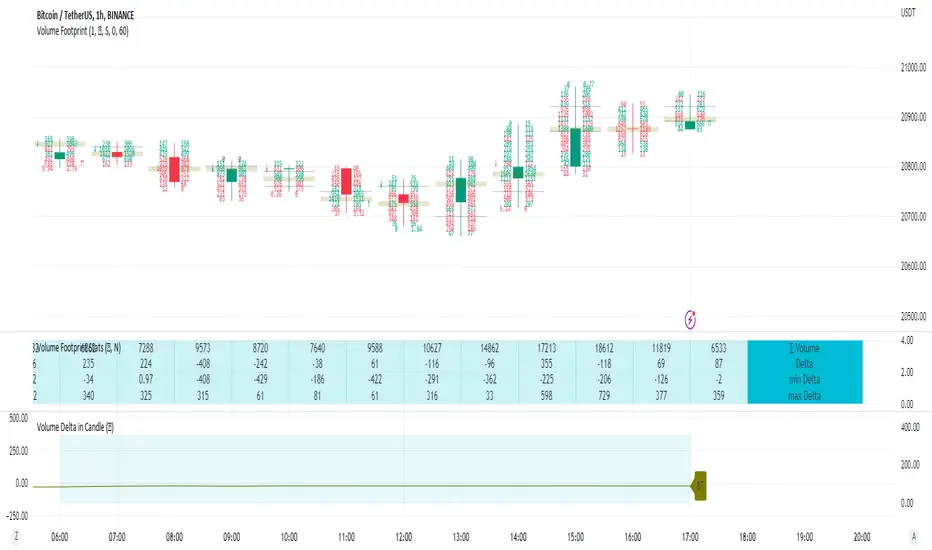
Supporting tool for "Volume Footprint" showing char of delta changes in current candle.
Chart is restarted with start of each new candle.
Script is collecting volume footprint with the precision picked by user. We recomend to use highest possible precision.
Unfortunatelly Trading View has many limitations.
If after adding script nothing is visible with error: "'The study references too many candles in history'" you need to use lower precision - It can be changed in script settings.
This script is a part of a toolkit called "Volume Footprint", containing few more tools:
Volume Footprint - Volume Footprint chart.
Volume Footprint Statistics - Script showing table with basic statistics about Up and Down Volume inside the candle.
Volume Delta - Showing candles of imbalance between Up and Down Volume changes inside candles.
Volume Delta In Candle- Chart showing history of imbalance between Up and Down Volume changes inside current candle.
Volume Cumulative Delta - Showing candles of imbalance changes between UP and Down Volume cumulated in trading time equal to interval.
Volume Cumulative Delta in Interval- Chart showing history of imbalance changes between UP and Down Volume cumulated in trading time equal to interval.
This script can be used by any user. You do not need to have PRO or PREMIUM account to use it.
Script with limited access, contact author to get authorization
User Interface:
Script is drawing a line of values demonstrating how Delta was changing inside current candle.
Current value of Delta is shown in the label on the right side of the chart.
Chart is drawing dynamically and can easiely hit TradingView limitations. If your chart is shorter and ends before vertical line, you can simplify it by turning "Simplify" checkbox in Settings.
Chart also cannot be longer than the source one.
Script settings:
Data precision - One of 6 levels of data precision: ▉▇▆▅▃▁, where ▉ means the highest precision and ▁ the lowest available precision. On 15 minute chart highest precision should be available, but on 1D it will probably hit TradingView limitations and script will not be even launched by the platform with error: "'The study references too many candles in history'". The general recommendation is to use the highest available precision for a given instrument and interval.
Background - Drawing background under chart area.
Line color - Color of data line over the chart.
Simplify drawing - Visualization option that skips some shape detail in exchange for a longer history of value.
Troubleshooting:
In case of any problems, send error details to the author of the script.
Known issues:
"The study references too many candles in history" - Change "Data precision" settings to some lower value.
릴리즈 노트
Package of improvements 릴리즈 노트
Package of improvements:- Addition precision levels dedicated to 1W and 1M charts.
- Verification with main script feature
- Improved error reporting
초대 전용 스크립트
이 스크립트는 작성자가 승인한 사용자만 접근할 수 있습니다. 사용하려면 요청 후 승인을 받아야 하며, 일반적으로 결제 후에 허가가 부여됩니다. 자세한 내용은 아래 작성자의 안내를 따르거나 Investor_R에게 직접 문의하세요.
이 비공개 초대 전용 스크립트는 스크립트 모더레이터의 검토를 거치지 않았으며, 하우스 룰 준수 여부는 확인되지 않았습니다. 트레이딩뷰는 스크립트의 작동 방식을 충분히 이해하고 작성자를 완전히 신뢰하지 않는 이상, 해당 스크립트에 비용을 지불하거나 사용하는 것을 권장하지 않습니다. 커뮤니티 스크립트에서 무료 오픈소스 대안을 찾아보실 수도 있습니다.
작성자 지시 사항
To get access or report problem write on toolkit4trading@proton.me
To get access or report problem write on toolkit4trading@proton.me
More details on Website and Youtube.
More details on Website and Youtube.
면책사항
해당 정보와 게시물은 금융, 투자, 트레이딩 또는 기타 유형의 조언이나 권장 사항으로 간주되지 않으며, 트레이딩뷰에서 제공하거나 보증하는 것이 아닙니다. 자세한 내용은 이용 약관을 참조하세요.