PROTECTED SOURCE SCRIPT
filbfilbs Better OBV
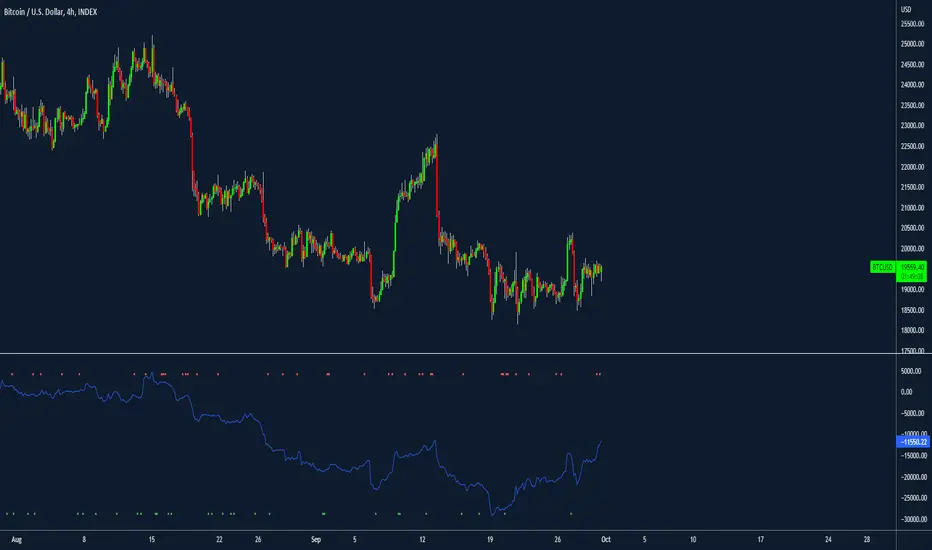
This indicator looks at the delta on the buying and selling volume of customizable lower timeframes to the timeframe selected and cumulates the delta between the buying and selling of those candles.
For example on a 4-hour chart, it will look at the 1 min timeframes and consider the delta by LTF candle, ranter than the summised view on the 4-hour.
In essence, it is trying to replicate CVD using time and price data without the order book, it becomes a "better, lower timeframe based, customizable OBV"
It also prints divergence as squares above or below the chart, where, for example, there would be buying on LTFs but the HTF candle closes red, this would be shown as bearish divergence.
Credit to Trading view and their up / down indicator, which this is a derivative of.
Any questions please ask!
보호된 스크립트입니다
이 스크립트는 비공개 소스로 게시됩니다. 하지만 이를 자유롭게 제한 없이 사용할 수 있습니다 – 자세한 내용은 여기에서 확인하세요.
면책사항
해당 정보와 게시물은 금융, 투자, 트레이딩 또는 기타 유형의 조언이나 권장 사항으로 간주되지 않으며, 트레이딩뷰에서 제공하거나 보증하는 것이 아닙니다. 자세한 내용은 이용 약관을 참조하세요.
면책사항
해당 정보와 게시물은 금융, 투자, 트레이딩 또는 기타 유형의 조언이나 권장 사항으로 간주되지 않으며, 트레이딩뷰에서 제공하거나 보증하는 것이 아닙니다. 자세한 내용은 이용 약관을 참조하세요.