INVITE-ONLY SCRIPT
Niteya BG Multi Indicator Multi Timeframe Scanner
Niteya BG Multi Indicator Multi Timeframe Scanner (NMIMTFS)
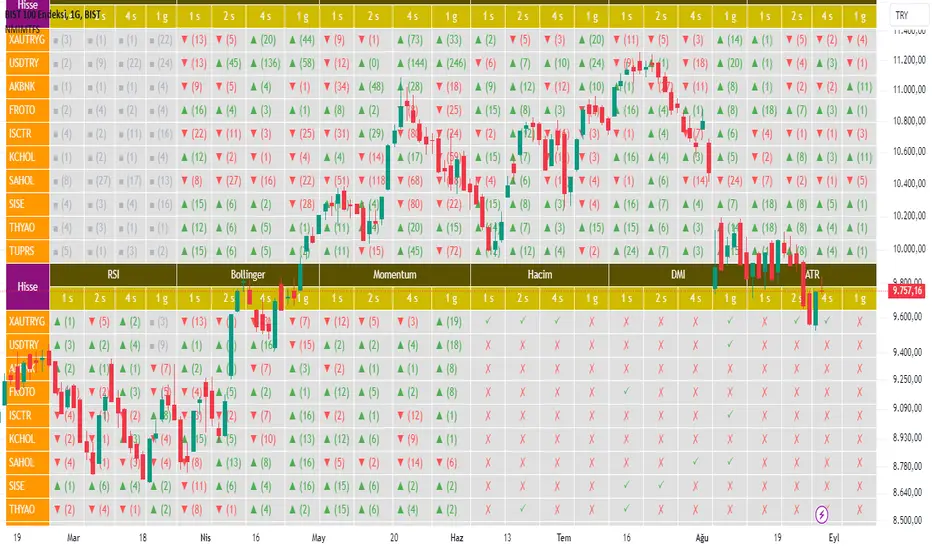
The indicator shows the values of 12 indicators in 4 different time intervals for 10 different tickers in a table.
bilgigunlugum.net/public/images/borsa/nmimtfs_table.png
You should set the chart timeframe to the value of the timeframe you selected that has the lowest value.
The main purpose of the indicator is to contribute to buy/sell decisions in a shorter time by providing access to the data without making any changes to the chart.
When you move the mouse over any cell on the table, you can see the details about the operation shown in that cell in an information window that opens:
Indicator features
Details
bilgigunlugum.net/borsa/pine_script/pine_script_indicator/nmimtfs
Türkçe açıklaması
Niteya BG Multi Indicator Multi Timeframe Scanner (NMIMTFS)
İndikatör, 10 farklı değer için, 12 indikatörün 4 farklı zaman aralığındaki değerlerini bir tabloda gösterir.
bilgigunlugum.net/public/images/borsa/nmimtfs_table.png
Grafik zaman aralığını, seçtiğiniz zaman aralıklarından en düşük değere sahip olanın değerine ayarlamalısınız.
İndikatörün temel amacı, grafikte değiklik yapmadan verilere erişim sğlayarak, daha kısa zamanda işlem için karar verilmesine katkı sağlamaktır.
Fareyi tablo üzerindeki herhangi bir hücrenin üzerine getirdiğinizde, o hücrede gösterilen işlemle ilgili detaylar açılan bir bilgi penceresinde gösterilir. Böylece, aşağıda gösterilen değerlere erişim sağlayabilirsiniz:
İndikatör özellikleri
Detaylar
bilgigunlugum.net/borsa/pine_script/pine_script_indicator/nmimtfs
The indicator shows the values of 12 indicators in 4 different time intervals for 10 different tickers in a table.
- EMA indicator
- KAMA indicator
- SuperTrend indicator
- Parabolic SAR indicator
- MACD indicator
- WaveTrend indicator
- RSI indicator
- Bollinger band indicator
- Momentum indicator
- Volume indicator
- DMI indicator
- ATR indicator
bilgigunlugum.net/public/images/borsa/nmimtfs_table.png
You should set the chart timeframe to the value of the timeframe you selected that has the lowest value.
The main purpose of the indicator is to contribute to buy/sell decisions in a shorter time by providing access to the data without making any changes to the chart.
When you move the mouse over any cell on the table, you can see the details about the operation shown in that cell in an information window that opens:
- The closing value and indicator values in the latest bar
- The status of the price and indicator values in the latest bar being larger or smaller than each other
- The trend status in the latest bar
- The date and time values where the price and indicator values cross each other
- The direction of the cross of the price and indicator values, level and bar index
Indicator features
- 4 time interval values can be changed.
- The input values of 12 indicators can be changed.
- The position of the indicator table on the chart can be changed.
- The ▲ sign in the table cells indicates an uptrend, the ▼ sign indicates a downtrend and the ■ sign indicates a neutral situation. The value in parentheses to the right of the signs indicates the bar index where the transaction took place.
- In the information window,
- The ↗ sign indicates that the value to the left of it intersects the value to the right of it upwards as many bars ago as the value in parentheses.
- The ↘ sign indicates that the value to the left of it intersects the value to the right of it downwards as many bars ago as the value in parentheses.
- The > sign indicates that the value on the left is greater than the value on the right by the value in parentheses.
- The + and - signs indicate the level of the indicators for WaveTrend, RSI and Bollinger indicators.
- Green colors indicate an uptrend and positive results, while red colors indicate a downtrend and negative results.
Details
bilgigunlugum.net/borsa/pine_script/pine_script_indicator/nmimtfs
Türkçe açıklaması
Niteya BG Multi Indicator Multi Timeframe Scanner (NMIMTFS)
İndikatör, 10 farklı değer için, 12 indikatörün 4 farklı zaman aralığındaki değerlerini bir tabloda gösterir.
- EMA indikatörü
- KAMA indikatörü
- SuperTrend indikatörü
- Parabolic SAR indikatörü
- MACD indikatörü
- WaveTrend indikatörü
- RSI indikatörü
- Bollinger bant indikatörü
- Momentum indikatörü
- Hacim indikatörü
- DMI indikatörü
- ATR indikatörü
bilgigunlugum.net/public/images/borsa/nmimtfs_table.png
Grafik zaman aralığını, seçtiğiniz zaman aralıklarından en düşük değere sahip olanın değerine ayarlamalısınız.
İndikatörün temel amacı, grafikte değiklik yapmadan verilere erişim sğlayarak, daha kısa zamanda işlem için karar verilmesine katkı sağlamaktır.
Fareyi tablo üzerindeki herhangi bir hücrenin üzerine getirdiğinizde, o hücrede gösterilen işlemle ilgili detaylar açılan bir bilgi penceresinde gösterilir. Böylece, aşağıda gösterilen değerlere erişim sağlayabilirsiniz:
- En son bardaki kapanış değeri ve indikatör değerleri
- En son bardaki fiyat ve indikatör değerlerinin birbirine göre büyük ve küçük olma durumu
- En son bardaki trend durumu
- Fiyat ve indikatör değerlerinin kesiştiği tarih ve zaman değerleri
- Fiyat ve indikatör değerlerinin kesişme yönü, seviyesi ve bar endeksi
İndikatör özellikleri
- 4 zaman aralığı değeri değiştirilebilir.
- 12 indikatörün giriş değerleri değiştirilebilir.
- İndikatör tablosunun grafik üzerindeki konumu değiştirilebilir.
- Tablo hücrelerindeki ▲ işareti yükseliş trendini, ▼ işareti düşüş trendini ve ■ işareti nötr durumu ifade eder. İşaretlerin sağında parantez içinde yer alan değer ise işlemin gerçekleştiği bar endeksini göstermektedir.
- İpucu pencerelerinde,
- ↗ işareti solundaki değerin sağındaki değeri parantez içindeki değer kadar bar önce yukarı doğru kestiğini gösterir.
- ↘ işareti solundaki değerin sağındaki değeri parantez içindeki değer kadar bar önce aşağı doğru kestiğini gösterir.
- > işareti solundaki değerin sağındaki değerden parantez içindeki değer kadar bar önce daha büyük bir değer aldığını gösterir.
- + ve - işareti, WaveTrend, RSI ve Bollinger indikatörleri için, indikatörlerin seviyesini gösterir.
- Yeşil renkler yükseliş trendini ve olumlu sonuçları, kırmızı renkler ise düşüş trendini ve olumsuz sonuçları gösterir.
Detaylar
bilgigunlugum.net/borsa/pine_script/pine_script_indicator/nmimtfs
초대 전용 스크립트
이 스크립트는 작성자가 승인한 사용자만 접근할 수 있습니다. 사용하려면 요청 후 승인을 받아야 하며, 일반적으로 결제 후에 허가가 부여됩니다. 자세한 내용은 아래 작성자의 안내를 따르거나 Niteya에게 직접 문의하세요.
이 비공개 초대 전용 스크립트는 스크립트 모더레이터의 검토를 거치지 않았으며, 하우스 룰 준수 여부는 확인되지 않았습니다. 트레이딩뷰는 스크립트의 작동 방식을 충분히 이해하고 작성자를 완전히 신뢰하지 않는 이상, 해당 스크립트에 비용을 지불하거나 사용하는 것을 권장하지 않습니다. 커뮤니티 스크립트에서 무료 오픈소스 대안을 찾아보실 수도 있습니다.
작성자 지시 사항
Users can request access to the indicator via the e-mail address info@bilgigunlugum.net.
Kullanıcılar indikatöre erişim için info@bilgigunlugum.net e-posta adresinden talepte bulunabilirler.
면책사항
해당 정보와 게시물은 금융, 투자, 트레이딩 또는 기타 유형의 조언이나 권장 사항으로 간주되지 않으며, 트레이딩뷰에서 제공하거나 보증하는 것이 아닙니다. 자세한 내용은 이용 약관을 참조하세요.