OPEN-SOURCE SCRIPT
Rate of Change w/ Butterworth Filter
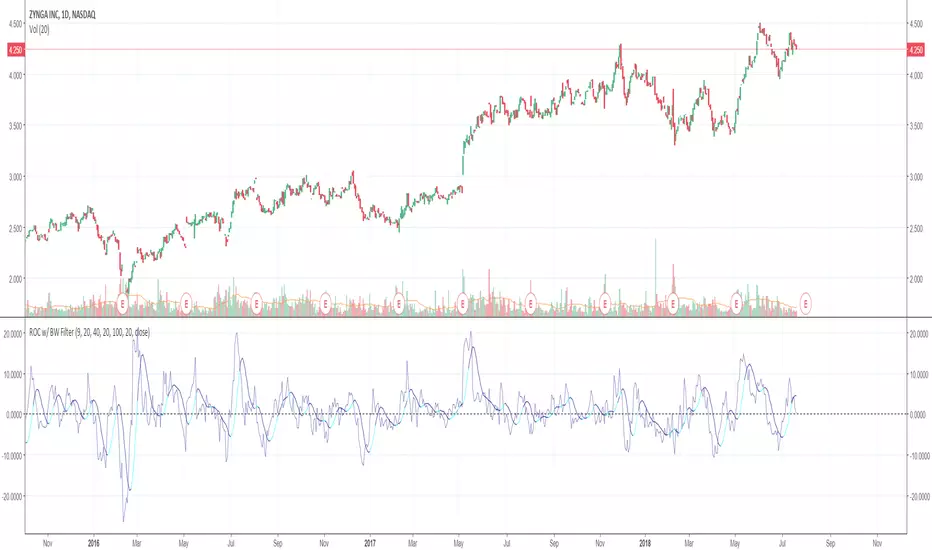
It passes the Rate of Change data through a Butterworth filter which creates a smooth line that can allow for easier detection of slope changes in the data over various periods of times.
The butterworth filter line and the rate of change are plotted together by default. The values for the lengths, for both the butterworth filter and the raw ROC data, can be changed from the format menu (through a toggle).
The shorter the Butterworth length, the closer the line is fitted to the raw ROC data, however you trade of with more frequent slope changes.
The longer the Butterworth length, the smoother the line and less frequent the slope changes, but the Butterworth line is farther of center from the raw ROC data.
오픈 소스 스크립트
트레이딩뷰의 진정한 정신에 따라, 이 스크립트의 작성자는 이를 오픈소스로 공개하여 트레이더들이 기능을 검토하고 검증할 수 있도록 했습니다. 작성자에게 찬사를 보냅니다! 이 코드는 무료로 사용할 수 있지만, 코드를 재게시하는 경우 하우스 룰이 적용된다는 점을 기억하세요.
면책사항
해당 정보와 게시물은 금융, 투자, 트레이딩 또는 기타 유형의 조언이나 권장 사항으로 간주되지 않으며, 트레이딩뷰에서 제공하거나 보증하는 것이 아닙니다. 자세한 내용은 이용 약관을 참조하세요.
오픈 소스 스크립트
트레이딩뷰의 진정한 정신에 따라, 이 스크립트의 작성자는 이를 오픈소스로 공개하여 트레이더들이 기능을 검토하고 검증할 수 있도록 했습니다. 작성자에게 찬사를 보냅니다! 이 코드는 무료로 사용할 수 있지만, 코드를 재게시하는 경우 하우스 룰이 적용된다는 점을 기억하세요.
면책사항
해당 정보와 게시물은 금융, 투자, 트레이딩 또는 기타 유형의 조언이나 권장 사항으로 간주되지 않으며, 트레이딩뷰에서 제공하거나 보증하는 것이 아닙니다. 자세한 내용은 이용 약관을 참조하세요.