OPEN-SOURCE SCRIPT
업데이트됨 ZigZag with Fibonacci Levels
Hello Traders,
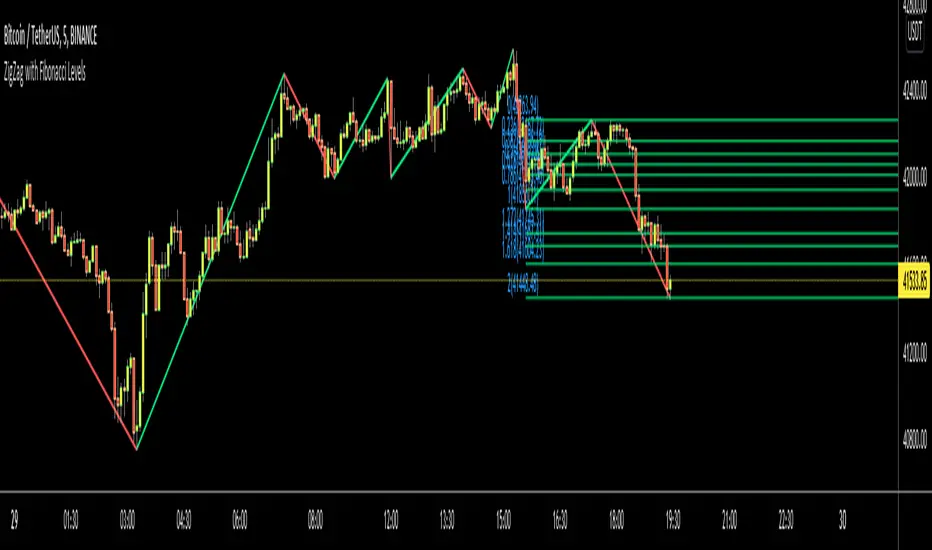
This is "ZigZag with Fibonacci Levels" script. It finds the ZigZag, draw Fibonacci lines and put labels accordingly. I get many requests for this script, so here it is.
You can set ZigZag period as you wish. Bigger numbers (such 20, 30) may give better perspective and result.
It draws Fibonacci levels between 0%-100% and If the price goes higher/lower than 100% level than the script draws Fibonacci Levels accordingly. This means it draws Fibonacci levels until this levels get higher/lower than the price.
As an example:

if you don't want to see ZigZag Lines then you have option to disable it and see only Fibonacci levels:

You have coloring options for Zigzag, Fibonacci lines and texts:

Enjoy!
This is "ZigZag with Fibonacci Levels" script. It finds the ZigZag, draw Fibonacci lines and put labels accordingly. I get many requests for this script, so here it is.
You can set ZigZag period as you wish. Bigger numbers (such 20, 30) may give better perspective and result.
It draws Fibonacci levels between 0%-100% and If the price goes higher/lower than 100% level than the script draws Fibonacci Levels accordingly. This means it draws Fibonacci levels until this levels get higher/lower than the price.
As an example:
if you don't want to see ZigZag Lines then you have option to disable it and see only Fibonacci levels:
You have coloring options for Zigzag, Fibonacci lines and texts:
Enjoy!
릴리즈 노트
Added Price Levels to the labels.릴리즈 노트
- You have now option to enable/disable following Fibonnaci Levels:---> 0.236
---> 0.382
---> 0.500
---> 0.618
---> 0.786
- "Label Location" option added. Fibonacci levels can be shown at Left or Right. when the session is closed then labels at right may not be shown accordingly.
An example: some fibonacci levels disabled, also labeling at right.
릴리즈 노트
Options improvedZigzag part improved
round_to_mintick() function used
bar_index is used for labels (instead of time)
릴리즈 노트
updated오픈 소스 스크립트
트레이딩뷰의 진정한 정신에 따라, 이 스크립트의 작성자는 이를 오픈소스로 공개하여 트레이더들이 기능을 검토하고 검증할 수 있도록 했습니다. 작성자에게 찬사를 보냅니다! 이 코드는 무료로 사용할 수 있지만, 코드를 재게시하는 경우 하우스 룰이 적용된다는 점을 기억하세요.
Our New Free Official Telegram Channel is t.me/+nOh3yWZOYINlOWIy
면책사항
해당 정보와 게시물은 금융, 투자, 트레이딩 또는 기타 유형의 조언이나 권장 사항으로 간주되지 않으며, 트레이딩뷰에서 제공하거나 보증하는 것이 아닙니다. 자세한 내용은 이용 약관을 참조하세요.
오픈 소스 스크립트
트레이딩뷰의 진정한 정신에 따라, 이 스크립트의 작성자는 이를 오픈소스로 공개하여 트레이더들이 기능을 검토하고 검증할 수 있도록 했습니다. 작성자에게 찬사를 보냅니다! 이 코드는 무료로 사용할 수 있지만, 코드를 재게시하는 경우 하우스 룰이 적용된다는 점을 기억하세요.
Our New Free Official Telegram Channel is t.me/+nOh3yWZOYINlOWIy
면책사항
해당 정보와 게시물은 금융, 투자, 트레이딩 또는 기타 유형의 조언이나 권장 사항으로 간주되지 않으며, 트레이딩뷰에서 제공하거나 보증하는 것이 아닙니다. 자세한 내용은 이용 약관을 참조하세요.