INVITE-ONLY SCRIPT
Mayfair Heatmap Volume 1.0
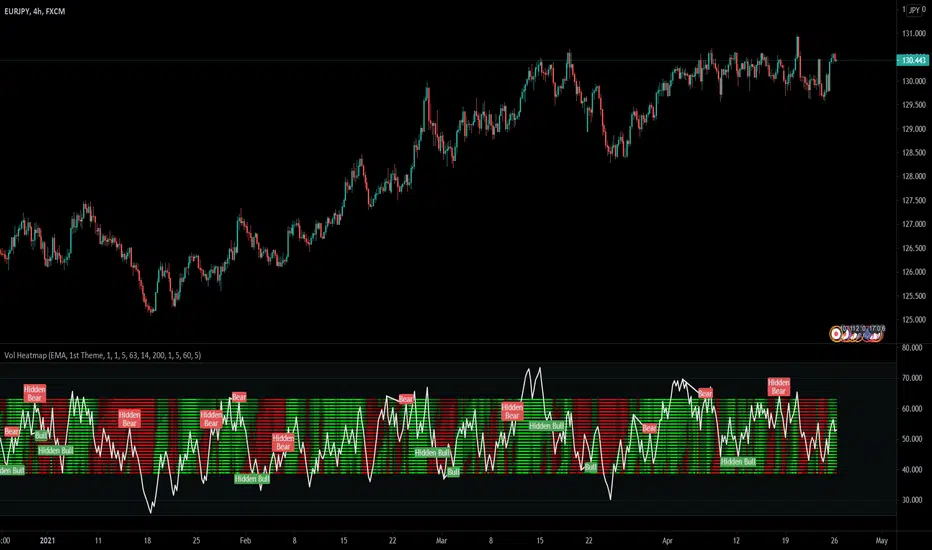
This is our most popular indicator. It gives three separate signals and is best used on a 4H timeframe, to alert you to trading opportunities.
The heatmap area represents buying and selling pressure.
The white line works like a volume-driven RSI indicator, indicating overbought/oversold situations.
There is also a divergence indicator, represented by the Bear/Bull Hidden Bear/Hidden Bull markers, which show where the price action and the indicator's direction are moving in different directions.
Like all indicators, it is not perfect, and you should never rely on one indicator in any situation, but this one alerts you to opportunities, which you can then study on lower timeframes to find an entry.
초대 전용 스크립트
이 스크립트는 작성자가 승인한 사용자만 접근할 수 있습니다. 사용하려면 요청 후 승인을 받아야 하며, 일반적으로 결제 후에 허가가 부여됩니다. 자세한 내용은 아래 작성자의 안내를 따르거나 Paul_Varcoe에게 직접 문의하세요.
트레이딩뷰는 스크립트의 작동 방식을 충분히 이해하고 작성자를 완전히 신뢰하지 않는 이상, 해당 스크립트에 비용을 지불하거나 사용하는 것을 권장하지 않습니다. 커뮤니티 스크립트에서 무료 오픈소스 대안을 찾아보실 수도 있습니다.
작성자 지시 사항
To buy this indicator, please click here: https://launchpass.com/mayfair-trading-and-mentoring/heatmap-volume
The link contains a video explaining the indicator in more detail.
eBook ON SURVIVAL: amazon.co.uk/dp/B0BSY763W3
THE CITY TRADERS: thecitytraders.com/?aff=9
Discord: discord.gg/Ma7SnExcWA
THE CITY TRADERS: thecitytraders.com/?aff=9
Discord: discord.gg/Ma7SnExcWA
면책사항
해당 정보와 게시물은 금융, 투자, 트레이딩 또는 기타 유형의 조언이나 권장 사항으로 간주되지 않으며, 트레이딩뷰에서 제공하거나 보증하는 것이 아닙니다. 자세한 내용은 이용 약관을 참조하세요.