OPEN-SOURCE SCRIPT
업데이트됨 Inside Candle Viewer
Inside Candle Viewer
What it’s meant for:
- This indicator is used to identify inside candles that might generate an upcoming trading range
- Works best on large timeframe (Suggested from 2 days up to 1 week) and crypto asset (Index don't show much because of daily gaps)
How it works:
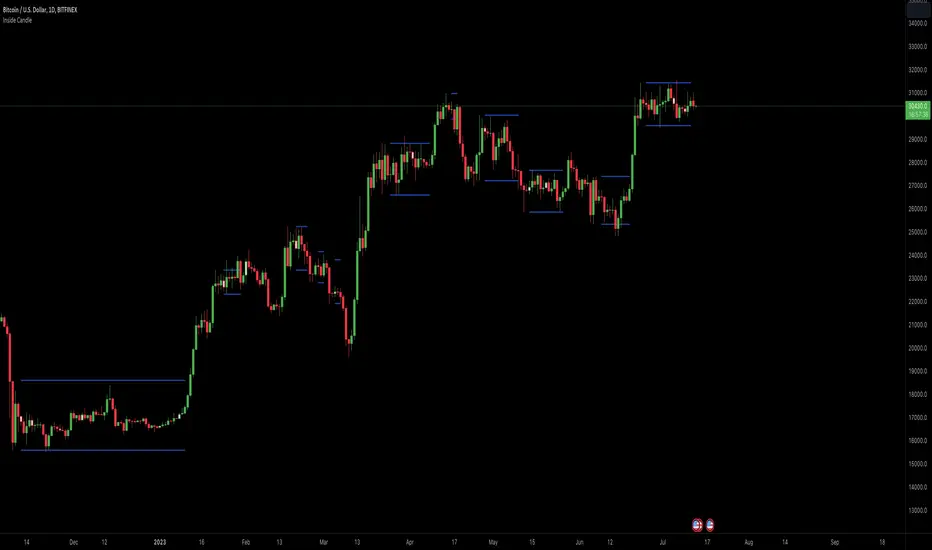
- It check for daily close (or the chosen timeframe), highlight inside candles and also plot trading range limits generated by inside pattern
- Trading range limits extend until candle closes are within those limits
- Usually the longer the trading range last, the stronger the following trend is when it break in any direction
Settings:
- Change color of inside bars and enable/disable from chart
- Change color of trading range and enable/disable from chart
Alerts:
- No alerts are defined at the moment
What it’s meant for:
- This indicator is used to identify inside candles that might generate an upcoming trading range
- Works best on large timeframe (Suggested from 2 days up to 1 week) and crypto asset (Index don't show much because of daily gaps)
How it works:
- It check for daily close (or the chosen timeframe), highlight inside candles and also plot trading range limits generated by inside pattern
- Trading range limits extend until candle closes are within those limits
- Usually the longer the trading range last, the stronger the following trend is when it break in any direction
Settings:
- Change color of inside bars and enable/disable from chart
- Change color of trading range and enable/disable from chart
Alerts:
- No alerts are defined at the moment
릴리즈 노트
Updated chart릴리즈 노트
- added timeframe selector: as in the shown chart you can be on a daily chart and force a 2 days inside range calculation오픈 소스 스크립트
트레이딩뷰의 진정한 정신에 따라, 이 스크립트의 작성자는 이를 오픈소스로 공개하여 트레이더들이 기능을 검토하고 검증할 수 있도록 했습니다. 작성자에게 찬사를 보냅니다! 이 코드는 무료로 사용할 수 있지만, 코드를 재게시하는 경우 하우스 룰이 적용된다는 점을 기억하세요.
면책사항
해당 정보와 게시물은 금융, 투자, 트레이딩 또는 기타 유형의 조언이나 권장 사항으로 간주되지 않으며, 트레이딩뷰에서 제공하거나 보증하는 것이 아닙니다. 자세한 내용은 이용 약관을 참조하세요.
오픈 소스 스크립트
트레이딩뷰의 진정한 정신에 따라, 이 스크립트의 작성자는 이를 오픈소스로 공개하여 트레이더들이 기능을 검토하고 검증할 수 있도록 했습니다. 작성자에게 찬사를 보냅니다! 이 코드는 무료로 사용할 수 있지만, 코드를 재게시하는 경우 하우스 룰이 적용된다는 점을 기억하세요.
면책사항
해당 정보와 게시물은 금융, 투자, 트레이딩 또는 기타 유형의 조언이나 권장 사항으로 간주되지 않으며, 트레이딩뷰에서 제공하거나 보증하는 것이 아닙니다. 자세한 내용은 이용 약관을 참조하세요.