OPEN-SOURCE SCRIPT
업데이트됨 Major Currency RSI Indicator (MCRSI)
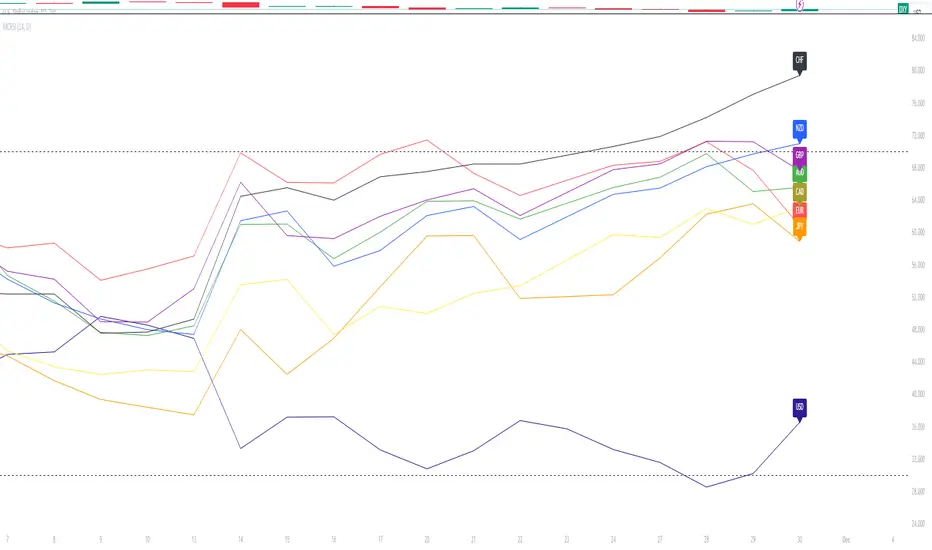
Experience the power of multi-dimensional analysis with our Multi-Currency RSI Indicator (MCRSI). This innovative tool allows traders to simultaneously track and compare the Relative Strength Index (RSI) of eight different currencies in a single chart.
The MCRSI calculates the RSI for USD (DXY), EUR (EXY), JPY (JXY), CAD (CXY), AUD (AXY), NZD (ZXY), GBP (BXY), and CHF (SXY), covering a broad range of the forex market. Each RSI line is color-coded for easy differentiation and equipped with labels at the last bar for a clutter-free view.
Our indicator is designed with user-friendly customization features. You can easily adjust the length of the RSI and the time frame according to your trading strategy. It also handles gaps in the chart data with the barmerge.gaps_on option, ensuring accurate and consistent RSI calculations.
Whether you are a novice trader seeking to understand market dynamics better or an experienced trader wanting to diversify your technical analysis, the MCRSI offers a unique perspective of the forex market. This multi-currency approach can help identify potential trading opportunities that could be missed when analyzing currencies in isolation.
Harness the power of multi-currency RSI analysis with our MCRSI Indicator. It's time to step up your trading game!
Features:
Tracks 8 different currencies simultaneously
Color-coded RSI lines for easy identification
Customizable RSI length and time frame
Handles gaps in chart data
Last bar labels for a clutter-free view
Ideal for forex traders of all experience levels
How to Use:
Add the MCRSI to your TradingView chart.
Adjust the RSI length and time frame as needed.
Monitor the RSI lines and their intersections for potential trading signals.
Happy trading!
릴리즈 노트
We have changed the location of the labels to make it easier to comprehend by users오픈 소스 스크립트
트레이딩뷰의 진정한 정신에 따라, 이 스크립트의 작성자는 이를 오픈소스로 공개하여 트레이더들이 기능을 검토하고 검증할 수 있도록 했습니다. 작성자에게 찬사를 보냅니다! 이 코드는 무료로 사용할 수 있지만, 코드를 재게시하는 경우 하우스 룰이 적용된다는 점을 기억하세요.
면책사항
해당 정보와 게시물은 금융, 투자, 트레이딩 또는 기타 유형의 조언이나 권장 사항으로 간주되지 않으며, 트레이딩뷰에서 제공하거나 보증하는 것이 아닙니다. 자세한 내용은 이용 약관을 참조하세요.
오픈 소스 스크립트
트레이딩뷰의 진정한 정신에 따라, 이 스크립트의 작성자는 이를 오픈소스로 공개하여 트레이더들이 기능을 검토하고 검증할 수 있도록 했습니다. 작성자에게 찬사를 보냅니다! 이 코드는 무료로 사용할 수 있지만, 코드를 재게시하는 경우 하우스 룰이 적용된다는 점을 기억하세요.
면책사항
해당 정보와 게시물은 금융, 투자, 트레이딩 또는 기타 유형의 조언이나 권장 사항으로 간주되지 않으며, 트레이딩뷰에서 제공하거나 보증하는 것이 아닙니다. 자세한 내용은 이용 약관을 참조하세요.