INVITE-ONLY SCRIPT
업데이트됨 Trend Identifier
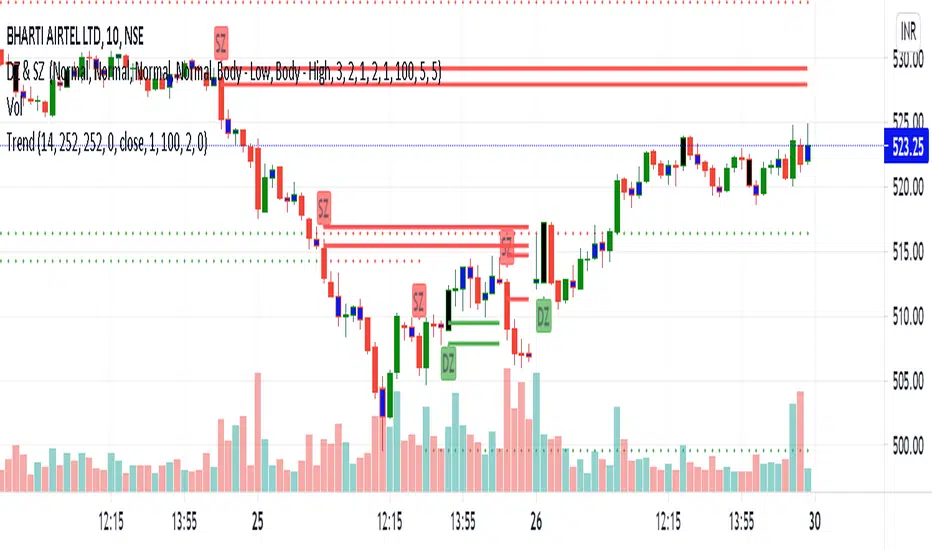
Trend Identifier Indicator helps to identify the Trend of intermediate time frame automatically.
It shows the trend and RSI position for Intraday, Daily and Swing time-frame in one go.
IF RSI is > 70 = RSI High
RSI is < 65 > 35 = RSI Side
RSI is < 30 = RSI Low
For Trend High, Low and Side, it makes it's own calculation and identifies the trend for intermediate time frame.
It also shows the standard deviation information.
1sd = 1 standard deviation achieved.
2sd = 2 standard deviation achieved.
Weekly and Monthly std = Weekly and Monthly standard deviation achieved.
Based on your trading style one can hide the other trend std and RSI option.
PM us to obtain the access.
릴리즈 노트
- Few enhancement - Added Pivot support and Resistance which will compliment the Demand and Supply zones.
초대 전용 스크립트
이 스크립트는 작성자가 승인한 사용자만 접근할 수 있습니다. 사용하려면 요청 후 승인을 받아야 하며, 일반적으로 결제 후에 허가가 부여됩니다. 자세한 내용은 아래 작성자의 안내를 따르거나 SupplyIsInDemand에게 직접 문의하세요.
트레이딩뷰는 스크립트의 작동 방식을 충분히 이해하고 작성자를 완전히 신뢰하지 않는 이상, 해당 스크립트에 비용을 지불하거나 사용하는 것을 권장하지 않습니다. 커뮤니티 스크립트에서 무료 오픈소스 대안을 찾아보실 수도 있습니다.
작성자 지시 사항
Please PM to get the access for a week.
면책사항
해당 정보와 게시물은 금융, 투자, 트레이딩 또는 기타 유형의 조언이나 권장 사항으로 간주되지 않으며, 트레이딩뷰에서 제공하거나 보증하는 것이 아닙니다. 자세한 내용은 이용 약관을 참조하세요.