INVITE-ONLY SCRIPT
업데이트됨 Zentrading Trend Follower_v1.1
For more information on how to use and how to subscribe please visit
zentrading.co
Our ZenTrend Follower is designed to get you into trends in a safe an risk averse manner. It does not only provide you with buy and sell signals forcing you to either react quickly or miss the trade. Rather, our algorithm detects when a trend setup is active and plots a breakout level where you can enter the trade. This also makes it easy for you to scan many assets quickly: All you need to do is see if the indicator has detected a setup, if not, move on!
To ensure that you capture the trend, the indicator indicator shows you where to place your stop loss as the trend progresses. We will also show you a few other simple ways to exit the trades at higher profit levels in the detailed manual you receive after purchasing the indicator.
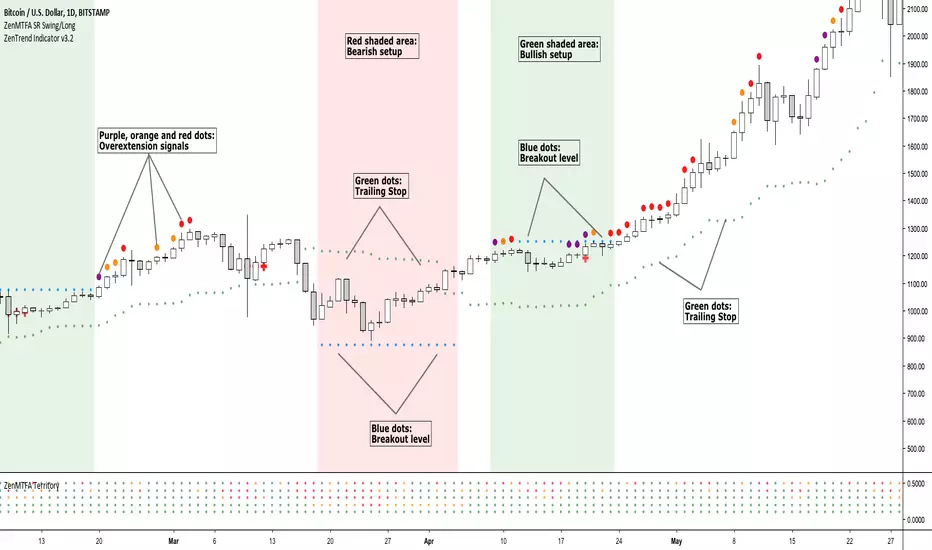
The shaded areas on the chart indicate that a trade setup has been detected by the algorithm: Green for bullish setups, red for bearish setups. The blue dots are the breakout level, if the price breaks this level the trade is entered. (as you can see on the chart, they can sometimes move towards the price!) Red crosses are plotted as your trailing stop loss, if price breaks the stop loss the trade is closed.
zentrading.co
Our ZenTrend Follower is designed to get you into trends in a safe an risk averse manner. It does not only provide you with buy and sell signals forcing you to either react quickly or miss the trade. Rather, our algorithm detects when a trend setup is active and plots a breakout level where you can enter the trade. This also makes it easy for you to scan many assets quickly: All you need to do is see if the indicator has detected a setup, if not, move on!
To ensure that you capture the trend, the indicator indicator shows you where to place your stop loss as the trend progresses. We will also show you a few other simple ways to exit the trades at higher profit levels in the detailed manual you receive after purchasing the indicator.
The shaded areas on the chart indicate that a trade setup has been detected by the algorithm: Green for bullish setups, red for bearish setups. The blue dots are the breakout level, if the price breaks this level the trade is entered. (as you can see on the chart, they can sometimes move towards the price!) Red crosses are plotted as your trailing stop loss, if price breaks the stop loss the trade is closed.
릴리즈 노트
Added Alerts. Now easier to set alerts for Setups, Entries and Exits.To add alert click on the indicator on you chart, and click on the "Add alert on Zen-Trend Follower". Then Select the condition you want alerts for (Long Setup, Short Setup, Long Entry, Short Entry, Long Exit, Short Exit).
릴리즈 노트
We've updated the algorithm to include re-entry points into trends and overextension signals to help you exit at better pricesThe link to the new manual and how to use:
tinyurl.com/y9s685hz
We'll have short trial periods every once in a while for new users to try the indicator out. We'll start the first one very shortly :) follow us so you won;t mis it!
릴리즈 노트
Updated for better performance across timeframes and assets- New entry filters
- New trailing stop
Principles remain the same:
Look for Bullish or Bearish Setups - green shaded areas signal a bullish setup, red shaded areas signal a bearish setup
Look for breakout - blue dots are the breakout level, trade is triggered if price crosses it
Stop Loss - Either swing low, or use the green dots as a trailing stop
Overextension - purple, orange and red dots. Consider tightening stop or taking partial profits.
If you have any questions send me a pm!
릴리즈 노트
Updated for better performance across timeframes and assets New entry filters
New trailing stop
Principles remain the same:
Look for Bullish or Bearish Setups - green shaded areas signal a bullish setup, red shaded areas signal a bearish setup
Look for breakout - blue dots are the breakout level, trade is triggered if price crosses it
Stop Loss - Either swing low, or use the green dots as a trailing stop
Overextension - purple, orange and red dots. Consider tightening stop or taking partial profits.
If you have any questions send me a pm!
릴리즈 노트
added tighter stop functionpossibility to plot ichimoku
buffer values adjusted for true range
alerts on long or short setups
초대 전용 스크립트
이 스크립트는 작성자가 승인한 사용자만 접근할 수 있습니다. 사용하려면 요청 후 승인을 받아야 하며, 일반적으로 결제 후에 허가가 부여됩니다. 자세한 내용은 아래 작성자의 안내를 따르거나 DariusZen에게 직접 문의하세요.
트레이딩뷰는 스크립트의 작동 방식을 충분히 이해하고 작성자를 완전히 신뢰하지 않는 이상, 해당 스크립트에 비용을 지불하거나 사용하는 것을 권장하지 않습니다. 커뮤니티 스크립트에서 무료 오픈소스 대안을 찾아보실 수도 있습니다.
작성자 지시 사항
면책사항
해당 정보와 게시물은 금융, 투자, 트레이딩 또는 기타 유형의 조언이나 권장 사항으로 간주되지 않으며, 트레이딩뷰에서 제공하거나 보증하는 것이 아닙니다. 자세한 내용은 이용 약관을 참조하세요.